Thursday, April 30, 2009

Market Commentary

Market Commentary
Click here for a link to ORIGINAL article:

By Capital Multiplier | 30 April 2009

One of the notable features of the stock market’s recent rally has been the surge in battered U.S. banks and financials in anticipation of the results of the American government’s "stress tests" on the nation's 19 largest financial institutions. Recently, The Federal Reserve released details of how it conducted the "stress tests" and announced that "most banks currently have capital levels well in excess of the amounts needed to be well capitalized." There you have it folks: those U.S. government bureaucrats who did not see this global financial crisis coming and who have so far done everything in their power to rescue those (favored) Wall street banks (of which Lehman Bros. was not one), and to hell with the global economy, have now declared the U.S. banking system to be "OK" and there is nothing to worry about. Must be time to back up the truck and buy bank stocks, right?

Not so fast! If there is one person who can be considered an expert on this topic it's William Black, former senior bank regulator who served as counsel to the Federal Home Loan Bank Board during the S&L Crisis of the 1980s. In recent interviews Mr. Black has described these bank stress tests as "a complete sham," and called the Treasury's toxic debt plan, "an enormous taxpayer subsidy for the people who caused the problem." According to Mr. Black,
"With most of America's biggest banks insolvent, you have, in essence, a multi-trillion dollar cover-up by publicly traded entities, which amounts to felony securities fraud on a massive scale. These firms will ultimately have to be forced into receivership, the management and boards stripped of office, title, and compensation. Right now, things don't look good. We are using taxpayer money via AIG to secretly bail out European banks like Société Générale, Deutsche Bank, and UBS— and even our own Goldman Sachs. The government is reluctant to admit the depth of the problem, because to do so would force it to put some of America's biggest financial institutions into receivership....And you have seen no regulatory action against what amounts to a $2 trillion accounting fraud."

Global economic reports showed further signs of deterioration last week as:
i) According to the latest report from the International Monetary Fund, losses for global financial institutions due to the current recession and credit crisis may reach $4.1 TRILLION by late next year! In a separate report, the IMF described the current downturn as "by far the deepest global recession since the Great Depression," and predicted the global economy will shrink 1.3%this year accompanied by growing unemployment levels worldwide,
ii) U.S. initial jobless claims rose last week to 640,000 while the number of people staying on jobless benefit rolls rose to a record 6.14 million last week,
iii) According to the National Association of Realtors, U.S. existing home sales fell 3% in March to a seasonally adjusted annual rate of 4.57 million units accompanied by another 12.5% year-over-year decline in the median sales price of existing homes,
iv) According to Britain's Office for National Statistics, the U.K. economy shrank 1.9% in the first quarter marking the sharpest decline in the country's GDP since 1979! The weak economy continues to take a heavy toll on the British job market pushing the unemployment rate to its highest level in 12 years…,
v) Spain's unemployment rate soared to 17.4% last month— with nearly 2 million jobs lost in just the past 12 months— as the European country continues to suffer the painful aftermath of one the biggest housing bubbles in history, and
vi) Reckless government spending plans continued to push U.S. interest rates higher last week with yields on benchmark 10-year notes touching their highest level in five weeks in anticipation of a flood of new supply. This could have significant negative ramifications for the housing market by pushing mortgage rates higher from their recent record low levels
vii) While there have been a few nascent signs of economic stabilization in recent weeks, the overall global macroeconomic scenario remains bleak because the reckless and irresponsible actions of global policymakers are increasing the risks in the global financial system! After their recent significant rally, stocks look ripe for a sizeable pullback. The depth of that pullback could provide important clues about future market direction.

ß§

Normxxx    
______________

The contents of any third-party letters/reports above do not necessarily reflect the opinions or viewpoint of normxxx. They are provided for informational/educational purposes only.

The content of any message or post by normxxx anywhere on this site is not to be construed as constituting market or investment advice. Such is intended for educational purposes only. Individuals should always consult with their own advisors for specific investment advice.

Wednesday, April 29, 2009

The 2012 Apocalypse

The 2012 Apocalypse— And How To Stop It

By Brandon Keim, Wired.com | 30 April 2009

April 17, 2009 | 2:37 Pm | Categories: Space, Survival

For scary speculation about the end of civilization in 2012, people usually turn to followers of cryptic Mayan prophecy, not NASA scientists. But that’s exactly what a group of researchers assembled at NASA described in a chilling report issued earlier this year on the destructive potential of solar storms.

Entitled
"Severe Space Weather Events— Understanding Societal and Economic Impacts," it describes the consequences of solar flares unleashing waves of energy that could disrupt Earth’s magnetic field, overwhelming high-voltage transformers with vast electrical currents and short-circuiting energy grids. Such a catastrophe would cost the United States "$1 trillion to $2 trillion in the first year," concluded the panel, and "full recovery could take 4 to 10 years." That would, of course, be just a fraction of global damages.

Good-bye, civilization.

Worse yet, the next period of intense solar activity is expected in 2012, and coincides with the presence of an unusually large hole in Earth’s geomagnetic shield. But the report received relatively little attention, perhaps because of 2012’s supernatural connotations. Mayan astronomers supposedly predicted that 2012 would mark the calamitous "birth of a new era".

Whether the Mayans were on to something, or this is all just a chilling coincidence, won’t be known for several years. But according to Lawrence Joseph, author of "Wired.com: A Scientific Investigation into Civilization’s End," "I’ve been following this topic for almost five years, and it wasn’t until the report came out that this really began to freak me out." Wired.com talked to Joseph and John Kappenman, CEO of electromagnetic damage consulting company MetaTech, about the possibility of a geomagnetic apocalypse— and how to stop it.

Wired.com: What’s the problem?

John Kappenman: We’ve got a big, interconnected grid that spans across the country. Over the years, higher and higher operating voltages have been added to it. This has escalated our vulnerability to geomagnetic storms. These are not a new thing. They’ve probably been occurring for as long as the sun has been around. It’s just that we’ve been unknowingly building an infrastructure that’s acting more and more like an antenna for geomagnetic storms.

Wired.com: What do you mean by antenna?

Kappenman: Large currents circulate in the network, coming up from the earth through ground connections at large transformers. We need these for safety reasons, but ground connections provide entry paths for charges that could disrupt the grid.

Wired.com: What’s your solution?

Kappenman: What we’re proposing is to add some fairly small and inexpensive resistors in the transformers’ ground onnections. The addition of that little bit of resistance would significantly reduce the amount of the geomagnetically induced currents that flow into the grid.

Wired.com: What does it look like?

Kappenman: In its simplest form, it’s something that might be made out of cast iron or stainless steel, about the size of a washing machine.

Wired.com: How much would it cost?

Kappenman: We’re still at the conceptual design phase, but we think it’s do-able for $40,000 or less per resistor. That’s less than what you pay for insurance for a transformer.

Wired.com: And less than what you’d willingly pay for insurance on civilization.

Kappenman: If you’re talking about the United States, there are about 5,000 transformers to consider this for. The Electromagnetic Pulse Commission recommended it in a report they sent to Congress last year. We’re talking about $150 million or so. It’s pretty small in the grand scheme of things. Big power lines and substations can withstand all the other known environmental challenges. The problem with geomagnetic storms is that we never really understood them as a vulnerability, and had a design code that took them into account.

Wired.com: Can it be done in time?

Kappenman: I’m not in the camp that’s certain a big storm will occur in 2012. But given time, a big storm is certain to occur in the future. They have in the past, and they will again. They’re about one-in-400-year events. That doesn’t mean it will be 2012. It’s just as likely that it could occur next week.

Wired.com: Do you think it’s coincidence that the Mayans predicted apocalypse on the exact date when astronomers say the sun will next reach a period of maximum turbulence?

Lawrence Joseph: I have enormous respect for Mayan astronomers. It disinclines me to dismiss this as a coincidence. But I recommend people verify that the Mayans prophesied what people say they did. I went to Guatemala and spent a week with two Mayan shamans who spent 20 years talking to other shamans about the prophecies. They confirmed that the Maya do see 2012 as a great turning point. Not the end of the world, not the great off-switch in the sky, but the birth of 'the fifth age'.

Wired.com: Isn’t a great off-switch in the sky exactly what’s described in the report?

Joseph: The chair of the NASA workshop was Dan Baker at the Laboratory for Atmospheric and Space Physics. Some of his comments, and the comments he approved in the report, are very strong about the potential connection between coronal mass ejections and power grids here on Earth. There’s a direct relationship between how technologically sophisticated a society is and how badly it could be hurt. That’s the meta-message of the report.

I had the good fortune last week to meet with John Kappenman at MetaTech. He took me through a meticulous two-hour presentation about just how vulnerable the power grid is, and how it becomes more vulnerable as higher voltages are sent across it. He sees it as a big antenna for space weather outbursts.

Wired.com: Why is it so vulnerable?

Joseph: Ultra-high voltage transformers become more finicky as energy demands are greater. Around 50 percent already can’t handle the current they’re designed for. A little extra current coming in at odd times can slip them over the edge.

The ultra-high voltage transformers, the 500,000- and 700,000-kilovolt transformers, are particularly vulnerable. The United States uses more of these than anyone else. China is trying to implement some million-kilovolt transformers, but I’m not sure they’re online yet.

Kappenman also points out that when the transformers blow, they can’t be fixed in the field. They often can’t be fixed at all. And, right now, there’s a one- to three-year lag time between placing an order and getting a new one.

According to Kappenman, there’s an as-yet-untested plan for inserting ground resistors into the power grid. It makes the handling a little more complicated, but apparently isn’t anything the operators can’t handle. I’m not sure he’d say these could be in place by 2012, as it’s difficult to establish standards, and utilities are generally regulated on a state-by-state basis. You’d have quite a legal thicket. But it still might be possible to get some measure of protection in by the next solar climax.

Wired.com: Why can’t we just shut down the grid when we see a storm coming, and start it up again afterwards?

Joseph: Power grid operators now rely on one satellite called ACE, which sits about a million miles out from Earth in what’s called the gravity well, the balancing point between sun and earth. It was designed to run for five years. It’s 11 years old, is losing steam, and there are no plans to replace it.

ACE provides about 15 to 45 minutes of heads-up to power plant operators if something’s coming in. They can shunt loads, or shut different parts of the grid. But to just shut the grid off and restart it is a $10 billion proposition, and there is lots of resistance to doing so. Many times these storms hit at the north pole, and don’t move south far enough to hit us. It’s a difficult call to make, and false alarms really piss people off. Lots of money is lost and damage incurred. But in Kappenman’s view, and in lots of others, this time burnt could really mean burnt.

Wired.com: Do you live your life differently now?

Joseph: I’ve been following this topic for almost five years. It wasn’t until the report came out that it began to freak me out. Up until this point, I firmly believed that the possibility of 2012 being catastrophic in some way was worth investigating. The report made it a little too real. That document can’t be ignored. And it was even written before the THEMIS satellite discovered a gigantic hole in Earth’s magnetic shield.

Ten or twenty times more particles are coming through this hole than expected. And astronomers predict that the way the sun’s polarity will flip in 2012 will make it point exactly the way we don’t want it to in terms of evading Earth’s magnetic field. It’s an astonoshingly bad set of coincidences.

Wired.com: If Barack Obama said, "Lets’ prepare," and there weren’t any bureaucratic hurdles, could we still be ready in time?

Joseph: I believe so. I’d ask the President to slipstream behind stimulus package funds already appropriated for smart grids, which are supposed to improve grid efficiency and help transfer high energies at peak times. There’s a framework there. Working within that, you could carve out some money for the ground resistors program, if those tests work, and have the initial momentum for cutting through the red tape. It’d be a place to start.

Tuesday, April 28, 2009

The Capital Well Is Running Dry

The Capital Well Is Running Dry And Some Economies Will Wither

By Ambrose Evans-Pritchard | 26 April 2009

The world is running out of capital. We cannot take it for granted that the global bond markets will prove deep enough to fund the $6 trillion or so needed for the Obama fiscal package, US-European bank bail-outs, and ballooning deficits almost everywhere.

Unless this capital is forthcoming, a clutch of countries will prove unable to roll over their debts at a bearable cost. Those that cannot print money to tide them through, either because they no longer have a national currency (Ireland, Club Med), or because they borrowed abroad (East Europe), run the biggest risk of default. Traders already whisper that some governments are buying their own debt through proxies at bond auctions to keep up illusions— not to be confused with transparent buying by central banks under quantitative easing. This cannot continue for long.

Commerzbank said every European bond auction is turning into an "event risk". Britain too finds itself some way down the AAA pecking order as it tries to sell £220bn of Gilts this year to irascible investors, astonished by 5% deficits into the middle of the next decade.

US hedge fund Hayman Advisers is betting on the biggest wave of state bankruptcies and restructurings since 1934. The worst profiles are almost all in Europe— the epicentre of leverage, and denial. As the IMF said last week, Europe's banks have written down 17% of their losses— American banks have swallowed half.

"We have spent a good part of six months combing through the world's sovereign balance sheets to understand how much leverage we are dealing with. The results are shocking," said Hayman's Kyle Bass. It looked easy for Western governments during the credit bubble, when China, Russia, emerging Asia, and petro-powers were accumulating $1.3 trillion a year in reserves, recycling this wealth back into US Treasuries and agency debt, or European bonds.

The tap has been turned off. These countries have become net sellers. Central bank holdings have fallen by $248bn to $6.7 trillion over the last six months. The oil crash has forced both Russia and Venezuela to slash reserves by a third. China let slip last week that it would use more of its $40bn monthly surplus to shore up growth at home and invest in harder assets— perhaps mining companies.

The National Institute for Economic and Social Research (NIESR) said last week that, since UK debt topped 200% of GDP after the Second World War, we can comfortably manage the debt-load in this debacle (80% to 100%). Variants of this argument are often made for the rest of the OECD club.

But our world is nothing like the late 1940s, when large families were rearing the workforce that would master the debt. Today we face demographic retreat. West and East are both tipping into old-aged atrophy (though the US is in best shape among the OECD, nota bene).

Japan's $1.5 trillion state pension fund— the world's biggest— dropped a bombshell this month. It will start selling holdings of Japanese state bonds this year to cover a $40bn shortfall on its books. So how is the Ministry of Finance going to fund a sovereign debt expected to reach 200% of GDP by 2010— also the world's biggest— even assuming that Japan's industry recovers from its 38% crash?

Japan is the first country to face a shrinking workforce in absolute terms, crossing the dreaded line in 2005. Its army of pensioners is dipping into the collective coffers. Japan's savings rate has fallen from 14% of GDP to 2% since 1990. Such a fate looms for Germany, Italy, Korea, Eastern Europe, and eventually China as well.

So where is the $6 trillion going to come from this year, and beyond? For now we must fall back on the Fed, the Bank of England, and fellow central banks, relying on QE (printing money) to pay for our schools, roads, and administration. It is necessary, alas, to stave off debt deflation. But it is also a slippery slope, as Fed hawks keep reminding their chairman Ben Bernanke.

Threadneedle Street may soon have to double its dose to £150bn, increasing the Gilt load that must eventually be fed back onto the market. The longer this goes on, the bigger the headache later. The Fed is in much the same bind. One wonders if Mr Bernanke regrets saying so blithely that Washington can create unlimited dollars "at essentially no cost".

Hayman Advisers says the default threat lies in the cocktail of spiralling public debt and the liabilities of banks— like RBS, Fortis, or Hypo Real— that are landing on sovereign ledger books. "The crux of the problem is not sub-prime, or Alt-A mortgage loans, or this or that bank. Governments around the world have allowed their banking systems to grow unchecked, in some cases growing into an untenable liability for the host country," said Mr Bass.

A disturbing number of states look like Iceland [[liabilities at 8.5 times GDP: normxxx]] once you dig into the entrails, and most are in Europe where liabilities average 4.2 times GDP, compared with 60%-70% for the US. "There could be a cluster of defaults over the next three years, possibly sooner," he said.

Research by former IMF chief economist Ken Rogoff and professor Carmen Reinhart found that spasms of default occur every several generations, each time shattering the illusions of bondholders. Half the world succumbed in the 1830s and again in the 1930s. The G20 deal to triple the IMF's fire-fighting fund to $750bn buys time for the likes of Ukraine and Argentina. But the deeper malaise is that so many of the IMF's backers are themselves exhausting their credit lines and cultural reserves.

Great bankruptcies change the world. Spain's defaults under Philip II ruined the Catholic banking dynasties of Italy and south Germany. It shifted the locus of financial and commercial power to Amsterdam. Anglo-Dutch forces were able to halt the Counter-Reformation, free northern Europe from absolutism, and break into North America.

Who knows what revolutions may come from this crisis if it reaches to the level of defaults by the major countries. My hunch is that it would expose Europe's deep fatigue— brutally so— reducing the Old World to a backwater. Whether US hegemony remains intact is an open question. I would bet on a US-China condominium for a quarter century, or just G2 for short.

ß§

Normxxx    
______________

The contents of any third-party letters/reports above do not necessarily reflect the opinions or viewpoint of normxxx. They are provided for informational/educational purposes only.

The content of any message or post by normxxx anywhere on this site is not to be construed as constituting market or investment advice. Such is intended for educational purposes only. Individuals should always consult with their own advisors for specific investment advice.

Cycle Revisited

Cycle Revisited

By Howard Ruff, The Ruff Times | 28 April 2009

John Williams publishes the Shadow Government Statistics newsletter (www.shadowstats.com). He is an amazing professional economist with a great grasp of the real economy. He and I have arrived at the same conclusions about almost everything in the economy, despite the fact that we approach it from totally different directions: me from the fundamentals, and he from a real technical and numbers point of view.

I am now in John’s home in Oakland, California, looking past the government numbers to get his views on the world as it really is. Shadow Government Statistics reconstructs published government statistics the accurate way we used to do it that reflects reality, rather than the way these numbers are now manipulated, and comes up with different conclusions about the economy, such as the Consumer Price Index (CPI), and other revealing areas published by government.

I trust John’s numbers because the government has been manipulating and restating these numbers for purely political purposes.

HJR: John is it necessary to recreate government statistics to show what you feel is reality, and how you have recreated them? I’d like some examples.

JW: Howard, I’ve been a consulting economist for about 27 years. I found early on that to make meaningful forecasts I had to have accurate information. It was evident early on that there were big inaccuracies in government reporting that I surveyed, e.g., at conventios of the National Association of Business Economists. Some economists have to make real-world forecasts, as opposed to those economists employed by Wall Street to come to up with 'happy stories' to encourage people to buy stocks and bonds.

I asked them what they considered the quality of government statistics to be. Most thought the numbers were very poor quality. And, political manipulation of the numbers tends to increase in election years. I talked to the chief economist for a large retail chain, and he told me that the retail sales reports were absolutely no good, but he thought the money-supply numbers were pretty good.

Next was an economist for a major bank. He said the money-supply numbers were not very good, but he thought the retail-sales numbers are pretty good. The more someone knew about a given statistic, the greater the problems he had with the numbers.

Over time public perceptions increasingly varied from what the government was reporting because the government kept changing methodologies, and usually tended to build a downside bias to the economic statistics related to unemployment or the Consumer Price Index (inflation), or an upside bias to those related to the GDP— the broad measure of economies.

When it became popularly used in auto-union contracts after WWII, the concept of the Consumer Price Index was fairly simple. But they wanted to measure changes in the cost of living, and they needed to maintain a constant standard of living. That was the traditional definition; the way the CPI had been designed.

That held pretty much in place until we got into the 1990s when Alan Greenspan and Michael Boskin, the head of The Council of Economic Advisors for the first Bush Administration, started talking about how the CPI really overstated inflation. The rationale was that when steak goes up in price, people buy more hamburger instead of steak; therefore you should reflect the substitution in the CPI(!)

That is not the concept of a constant standard of living; it is the concept of a declining standard of living that has no value to anyone other than politicians in Washington. They succeeded in reducing the reported level of inflation, which reduced cost-of-living adjustments in Social Security checks. Because of the changes in the 1990s, our Social Security checks are about half what they should be!

There have been different definitions [of unemployment] over time. The government itself publishes six levels of unemployment from what they call "U-1" through "U-6." The popularly followed measure is called "U-3." Right now they say it is around 8.6 percent

The broadest measure published by the government deletes "the discouraged workers" and people who are marginally attached to the economy. This is close to 16 percent. The key there is that the "discouraged workers" are people who consider themselves to be unemployed. They know whether or not they have jobs. The Discouraged Worker hasn’t been out looking for work because there are no jobs to be had for one with his skills in his area.

Up until 1994, those discouraged workers wouldn’t have had to specify how long the'd been discouraged. After that, if they were discouraged, the government simply wouldn’t add them. I add them into my numbers, and it now sums to around 20 percent total unemployment.

The popular unemployment number for the Great Depression was 25 percent general unemployment rate. It was 34 percent among non-farm workers. Today, we are mostly a non-farm economy. [[I believe the farm employment share is around 2% today.: normxxx]]

HJR: During the Bush Administration, we heard all the happy talk about how well the economy was doing because of the cuts in tax rates. Is that really just happy talk or was the economy really doing well under Bush?

JW: We actually had a pretty bad recession in the early’90s, longer and deeper than popularly reported. Near the end of H.W.Bush’s first term, at the time of the re-election race, a senior Commerce Department officer talked with a senior executive in the computer industry and asked him to boost the reporting of computer sales to the Bureau of Economic Analysis, which prepares the GDP report. They did, and it boosted the GDP, the broad measure of the economy, and George Bush touted the 'strong' economy. But the average worker just felt he had lost touch with reality.

The average guy has a pretty good sense of reality and knows whether or not economic conditions are good, or if inflation is up or down, which is why people have a difficult time accepting the government’s numbers. They have gotten so far away from common experience that people just don’t find them credible.

In terms of the GDP, clearly retail sales and industrial production were showing us a deepening recession long before the government reported it with the GDP. In fact, you didn’t show a contraction in the GDP until the second quarter of 2008. Officially the recession, according to the National Bureau of Economic Research, started back in December, 2007. If the GDP numbers accurately reflected what was happening, it would have at least shown the contraction two or three quarters before that. Other indications show that the recession really began in late 2006.

HJR: Let me get to a practical issue. What kind of economic activity should we support? For example, the conservatives will say we should cut tax rates to boost the economy. What does your research show?

JW: Cutting taxes is always a good idea. The private sector can do more with the money than the government can. Right now we are in a deep and deepening recession which will probably be called "a depression" before it ends. By depression, I mean a ten-percent contraction in overall economic activity.

When the government is reasonably solid, it can cut taxes. It can even increase spending without disrupting the system. Right now we have a system where the money being poured into the banking system, and the "stimulus" by way of spending and tax cuts, is all on top of record deficits. If you want to look at the real numbers on the deficits, based on numbers published by the federal government, we really should look at it how it used to be.

In the late ‘70s, the ten biggest accounting firms and congress said they could design an accounting system where the government will report its books the same way a company does. They finally got that into effect in 2000. Since then, instead of running deficits in the range of a couple of billion dollars, on a Generally Accepted Accounting Principal (GAAP) basis, the deficit has averaged $4 trillion a year. It was over $5 trillion in 2008 and will top $8 trillion this year.

This is unsustainable! You could not raise taxes enough to bring that into balance. If you wanted to bring it into balance, you’d have to eliminate Social Security and Medicare payments. It can’t be done.

HJR: Right now, Obama is spending money— I won’t say like a drunken sailor, because a drunken sailor spends his own money— but he is throwing trillions of dollars at the economic downturn, assuming it will stimulate us out. My personal opinion is that they are only stimulating government growth, and some day the average person may get a job, but his employer will be Uncle Sam.

What is the end result of creating all this money and throwing it at the problem?


JW: It will not stimulate the economy. The cost of all this is inflation. We will see inflation levels not seen in our lifetime by as early as the end of this year. Eventually we will see liabilities of $65 trillion— more than four times U.S. GDP, more than the global GDP. There will be a hyper inflation where the dollar becomes worthless, where the paper is worth more as wall paper than as currency.

HJR: They couldn’t even use the money as toilet paper because it is a bad absorber of water. So we will have hyper-inflation. How can we protect the value of our assets, assuming that people have some discretionary money? Should they buy growth stocks because they are cheap, assuming "buy low, sell high?" Or are there better alternatives?

JW: We are headed into a hyper-inflationary depression that will become a Great Depression. When hyper inflation hits, it will disrupt the normal flow of commerce and turn it into a Great Depression.

What about paper assets based on the dollar? You want to get into something like gold or silver— physical gold or silver, not paper. Perhaps get some assets outside the dollar. It’s a time to preserve your wealth and assets, not to start speculating on the stock market. There is a lot of volatility ahead. Over the long term, gold and silver are your best hedges.

HJR: That sounds like the familiar tune I’ve been singing for several years. I’ve been publishing for 33 years. About 11 of those years I have been bullish on gold and silver as investments. When I abandoned gold in the early ‘80s, I was excommunicated from the gold-bug church because I was supposed to stay faithful to gold, but then the metals weren’t the right place to put your money.

As a financial adviser, if I don’t have subscribers in the right investments, they will lose money and not renew their subscription to The Ruff Times. So I have a financial interest in being right. Yogi Berra said,
"It’s déjà vu all over again." The same thing is happening that I saw in the ‘70s that drove the prices of gold and silver to unprecedented highs— only more so now.

They are creating more money than they ever thought of creating back then. We are using words like
trillions, which we never used before. I’m not just looking at it as an investment and a place to make money. I am looking at it as a possible way to preserve the real value of your assets so you are not left destitute with a pile of worthless paper.

You showed me a display of Zimbabwe currency, where multi-billion dollar notes started out as
$2-bill notes. We could face the same thing. The world is littered with worthless dead-paper currencies with an average life span of about 75 years. It’s always the same: we make too much of it ever since we created paper currency with the printing press, creating too much of it to buy votes, diminishing its value.

A subscriber who wrote to me recently asked me that if the government and the bankers can manipulate the price of gold and silver, why couldn’t they do that for many years, so that the price of gold and silver would go nowhere? Yet history doesn’t record a single example of when a society inflated the dominant currency even close to the quantities of dollars we are creating now without destroying its value. Gold and silver, not being anyone’s debt or obligation, is where people ought to put their money.

I have been watching your work now for more than two years. I am amazed that you and I have arrived at the same conclusions from different sides of the street. I’ve learned a lot from your view of just the numbers; however, I’m a fundamentalist.

One reason I like you is because you agree with me. We like people who agree with us. Thanks so much for sharing your time and expertise with us.


JW: Thank you very much, Howard. I greatly appreciate the interview. I also appreciate your work. Indeed, we are in very broad and general agreement on where things are headed here. I have followed your work for many years; in fact, your writings back in the 1970s were part of my education as to the nature of the real world. Again, thank you, sir!

Shadow Government Statistics (www.shadowstats.com)

ß§

Normxxx    
______________

The contents of any third-party letters/reports above do not necessarily reflect the opinions or viewpoint of normxxx. They are provided for informational/educational purposes only.

The content of any message or post by normxxx anywhere on this site is not to be construed as constituting market or investment advice. Such is intended for educational purposes only. Individuals should always consult with their own advisors for specific investment advice.

The Cheapest Real Estate In The World

The Cheapest Real Estate In The World

By Tom Dyson | April 2009

"All of a sudden, it became a monster..."

I was on the phone with my friend Andrew. Andrew is 25 years old. He's been trying to get a business off the ground. Recently, his phones started ringing... and they're still ringing nonstop...

"A guy from Vegas called. He bought 35 houses with cash. Then a guy from Toronto called. He bought eight houses and a 186-unit apartment community. We just had another guy in from Toronto looking to buy 50 rental properties."

Someone else was speaking on a phone a few yards away. More phones rang in the background.

"We're getting calls from all over the world," said Andrew. "Tons of Americans are calling in. It's both. We've launched a website too... and we're already getting a lot of hits. We now have 22 agents working for us, full time."

My friend's city has the cheapest real estate in the world. But in the last six months, prices 'capitulated'. A price capitulation is what happens in the final throes of a bear market. It's the final death spasm that sends prices to ridiculously low levels for a moment before people regain their senses. "They call up and they want to buy houses for $500," Andrew says.

Andrew showed me a house his firm had bought for $750. They bought this house from a bank a couple months ago. It's almost in rental condition. This house sold for $110,000 in 2005.


Then he showed me a house they paid $20,000 for two months ago. It's a four-bedroom, three-bath, 1,900-square-foot house with a full basement. The bank mortgaged this house for $188,000 in 2006. It's in a fantastic neighborhood of well-maintained lawns, where people take pride in where they live.

Andrew is accumulating as much of this property as he can. Apartment buildings in wealthy neighborhoods are his favorite investments. His city is in a depression, and people don't want to own houses. So there's strong demand from people who want to rent. He says he can make returns of 15% to 20% a year in these properties...

Here's the thing: There's always a price that'll "clear" a market. When prices reach a certain level, buyers enter. This is one of the most important fundamental rules of speculation... and it never fails.

Andrew lives in Detroit. For years, there's been no life in Detroit's real estate market. This year, without explanation or fanfare, prices in Detroit property reached its clearance level. Now sentiment has turned around. The phones in Andrew's office have started ringing.

If the market for Detroit housing has found a bottom, maybe the property market in your hometown is close to making a bottom, too...

Good investing,

Tom

.

Look Out Below: Property Still In Sewer
A Look Back At Last Week's Important Events.

[[Actually, the week of the 20th: normxxx]]


By Robin Goldwyn Blumenthal, Ed., Barron's | April 2009

A single word comes to mind to describe global activity in commercial real estate in the first quarter: dreadful.

Worldwide sales volume simply fell off a cliff in the first three months, plunging to one-sixth its level of two years ago— and down 73% from 2008's first quarter— to a paltry $47 billion, according to Real Capital Analytics' quarterly Global Capital Trends report. In the U.S., there was barely $9 billion in commercial-property transactions, a sum that might have represented a single building a few short years ago.

"The commercial-sales market as we once knew it is basically nonexistent," says Dan Fasulo, a managing director at Real Capital and one of the authors of the report. The bid-ask spread is "as wide as it has been since the early '90s," he adds. In the first quarter, new reports of defaulted mortgages and failed commercial-property companies exceeded $55 billion, bringing the total of distressed assets to $153 billion.

The misery was widely distributed: Ireland saw a complete absence of sales, while 17 nations saw sales fall by 80% or more in the quarter versus 2008's first quarter. Price changes, meanwhile, varied from small gains to declines of 40% to 50% below those of a few years ago. Fasulo isn't too sanguine about prospects for improvement in the current quarter, although he notes that "we've seen a trickle of things picking up just over the past few weeks." He points to places like London and Paris, where markets have seen pricing beginning to correct.

To get the market back on track, says Fasulo, the distressed properties need to be cleared out, and the banks, some of which are lending, need to be more generous with their terms.

Now You Tell Us

Bank of America CEO Ken Lewis testified that he was 'pressured' by government officials into completing a deal to buy Merrill Lynch after Merrill's huge losses emerged, and was under the impression that then Treasury Secretary Henry Paulson and Fed Chairman Ben Bernanke 'didn't want him to disclose data about the deal to his investors'. The remarks appeared in a letter to Congress and U.S. securities regulators from New York Attorney General Andrew Cuomo, who is seeking a federal investigation. He said: "I was instructed that 'we do not want a public disclosure.'"

Under Stress

The Fed's methodology for conducting stress tests on the nation's 19 biggest banks is based on a more pessimistic economic forecast. The new criteria assume a 10.3% jobless rate at the end of 2010, a 3.3.% contraction in the U.S. economy in 2009, and just 0.5% growth in 2010. The bank said a need for additional capital wouldn't necessarily indicate a bank's insolvency. The IMF said the U.S. and European banks need $875 billion in equity by next year to recapitalize to pre-crisis levels.

Poor Performance

The Federal Reserve had 'unrealized losses' of $9.6 billion on some $74 billion of subprime mortgages and other toxic securities it took on after Bear Stearns and AIG collapsed. Losses on securities like home loans mean the U.S. taxpayer may have to reimburse the central bank through the TARP program.

The Numbers
The Government National Mortgage Association, known as Ginnie Mae, reported record issuance of mortgage-backed securities in March:
  • $34.5 billion: MBS issued by Ginnie Mae in March

  • $89.7 billion: total first-quarter issuance, versus $38.9 billion in the 2008 first quarter

  • $34.1 billion: total single-family MBS issuance in March

  • $334 million: total multi-family MBS issuance in March


Slight Reversal

The equity markets fell for the first time in seven weeks, though they finished close to their levels of a week ago. The Dow Jones Industrial Average ended at 8076.29 points, and the Standard & Poor's 500 Index closed at 866.23.

Shrinking Output

The global economy is expected to shrink this year for the first time since World War II, the IMF said. It projected a 1.3% drop in output.

Stuck In The Mud

Bank of America shares fell 24% after CEO Ken Lewis said credit "is bad and eventually will get worse before it… improves". The comments came after BofA posted a $4.2 billion profit, half of it due to 'accounting changes', but raised reserves for its other businesses. Morgan Stanley posted a loss, and slashed its dividend 81%.

No Public Placement

New York officials said they would ban lobbyists from soliciting business in public pension funds, amid a widening corruption investigation.

Mixed Bag

Ford posted a loss, but doesn't expect to see U.S. aid. General Motors will sell Pontiac. Chrysler moved closer to bankruptcy.

Odds 'N' Ends

New York Times posted a loss; it has no plans to go private.

Microsoft posted a drop in quarterly revenue, its first in 23 years.

ß§

Normxxx    
______________

The contents of any third-party letters/reports above do not necessarily reflect the opinions or viewpoint of normxxx. They are provided for informational/educational purposes only.

The content of any message or post by normxxx anywhere on this site is not to be construed as constituting market or investment advice. Such is intended for educational purposes only. Individuals should always consult with their own advisors for specific investment advice.

Sunday, April 26, 2009

Martin Armstrong: Economic Confidence Model Turn Date Is At Hand

Economic Confidence Model Turn Date Is At Hand
Click here for a link to ORIGINAL article:
By Martin Armstrong | 24 April 2009

Martin Armstrong says Major Turn at Hand— Batten Down The Hatches, Or…

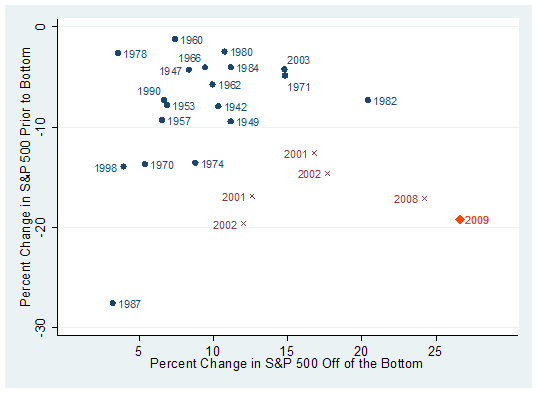
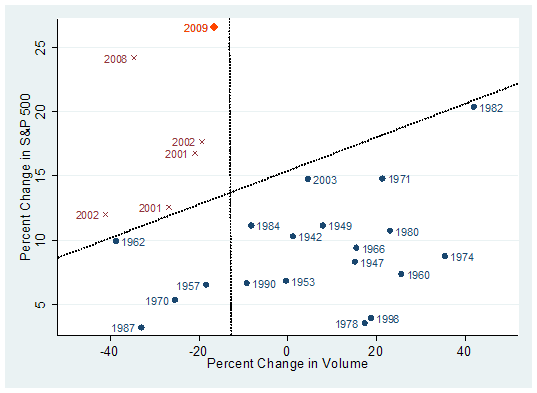
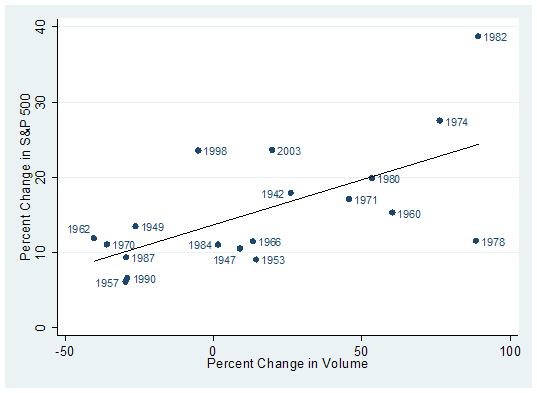
A turn date in Martin Armstrong's Economic Confidence Model passed on April 19th or 20th, depending on how many days you use to calculate a year. The graphic shows that the model is predicting a top at this turn date before heading down into a long-term low in June 2011. As Martin explains in the essay below, the model does not necessarily mean that a top in the Dow Industrials is at hand.

For instance, the 1989 turn date forecasted a top in the Japanese Nikkei. The Economic Confidence Model was created with inputs from around the world and therefore is not limited in scope to just pinpointing (U.S.) stock market tops and bottoms. Personally, I am looking at the US Dollar, the Treasury market or the Shanghai market for signs of a top. All these markets have experienced strong rallies off of recent bottoms and might be ready to turn lower.


[ Normxxx Here:  FWIW, Martin Armstrong seems like a certifiable nut case. However, many of his "turn" dates have proved eerily prescient.  ]


Why (Prospective) Models Are Our Only Hope

Should we create a model to manage our social-economy?

In the real world, experience counts as the primary attribute in any field. The question we face in the middle of this economic crisis is simply this: "Is there anyone at the helm who has any (immediately relevant) experience at all?" Can we disregard gathering the experience of those who have gone before us by constantly re-inventing the wheel for every crisis? Wouldn’t it be nice to have gathered a database so that when an economic panic took place, and we tried a particular stimulus, the result was a particular effect? Yet for every economic crisis, we seem to start over at the beginning retaining no knowledge or experience from the past, assuming in our arrogance that "that was then, this is now".

It is time to start taking advantage of the collective progress/knowledge of man that has developed, particularly during the last Century. We have not merely landed on the Moon, we have developed sophisticated computers to get us there. We have even conquered many forms of disease, also through the process of scientific learning and reasoning.

Science has revealed that our greatest form of knowledge comes not from book learning, but from hands-on experience. We have even begun to unravel how the human mind works. Now we understand that the difference between "book smart" and "street smart" is based upon the fact that when we learn only from study, we do not acquire the deeply seeded and critical knowledge base that our mind constructs when using all of the senses we refer to as 'experience'.

When we actually do something, we use all our senses and construct a knowledge base recording all the little nuances that are not always self-evident as being either important or relevant. I could read every book on brain surgery, but would you like to be my first live patient? Just as a medical student might have perfect book scores, they must still then start at a teaching hospital working under the critical guidance of those who have had actual, 'hands-on' experience.

The Importance Of Experience

What has emerged from the study of the human mind is that it takes practical experience in a field to truly comprehend what to do. There are two broad categories of memory as explained by Eric Jensen in his excellent work, "Teaching With The Brain In Mind."(ASCO— Assoc for Supervision and curriculum Development (2005)). The two primary types of memories are: (1) "explicit" (clearly formed or defined) that is constructed either by learning in a semantic manner (words and pictures) or more episodic (autobiographical or personal experience rather than learning about it second or third hand through books); and (2) "implicit" (implied by indirect means) that includes the reflexive memories and procedural physical or motor type routines like riding a bike, burning your hand, love, and other 'real-life' experiences.

Jensen points out that students that are typically taught by merely 'dumping on' facts, rarely retain such knowledge (ibid/pg 132). Jensen pointed out that studies have shown that students who attended class retained only 8% more than those who skipped class. Consequently, this semantic method of knowledge gathering is highly limited.

We need something more to strongly bond critical knowledge within our minds. We need the emotive forces of actual experience, which can be invoked only through the ancient method of hands-on 'apprenticeship'— which involves all the senses. It is now understood that the 'episodic' memory process "has unlimited capacity" (ibid/pg 134). This puts flesh on the words "book smart" and "street smart" illustrating that it is highly dangerous to trust the operation of anything to someone who has no real world experience of it.

Gathering Experience

This is why we need to collect the experiences of mankind and record them to a database that allows human interaction to query "why" events take place and "when" an event should take place, as well as "what" should be the correct response, and "how" should that response be implemented. [[In particular, such an experiential database must allow for learning, so that— as in humans— new knowledge is added onto and does not simply replace old knowledge.: normxxx]] History tends to 'repeat' because as a society we do not learn from past written histories. We lack the capacity to acquire real knowledge— of deep understanding— except through actual experience.

If we are afraid to construct such a model— that incorporates the total global experience of mankind to better manage our society and our economy— then we will be doomed to repeat the mistakes of the past, relying on an imperfect understanding of what the past has to tell us. [[Which, of course, begs the question of whether we have the capacity to construct any such model as yet that would not be very seriously limited. The "economic models" of our leading 'econometricians'— notoriously less reliable than that of meteorologists predicting weather— does not allow for such a sanguine assumption!: normxxx]]

History is no "random walk" through time. Everything is event driven, and history 'repeats' largely due to the fact that given similar events, mankind will react within a set parameter of reactions. [[On the other hand, while many historians try to supply one, history does not come complete with a plot— as witness how the same events are variously interpreted by different historians and at different times. I, myself, have a fixed belief that given a particular period of history to do over again, it would all come out differently!: normxxx]] Stick your finger in the flame of a candle and it matters not what culture you are from or the language you speak. You will still pull your finger out of the flame. [[But social forces are infinitely more complex than such a simple stimulus— as are the reactions of different human cultures, in time or place!: normxxx]]

Understanding There Is A Business Cycle

As I have stated many times, there is always a cycle within everything [[easy to say; quite another matter to prove, as many have tried over the millenia: normxxx]], and that includes the boom and bust swings within our economy that have caused so much political unrest, that it has fueled even the birth of Communism & affected the lives of mankind throughout recorded history. Economic swings have led to wars when a king’s finances were running low, and may have inspired the dreams of a utopia that influenced Karl Marx (1818-1883)— whose ideas have cost the lives of many millions of people.

Cycles may come in different patterns and are at times driven by a convergence of many individual events each functioning separately according to its own cyclical nature. This is simply the very essence of how everything functions throughout life and the entire universe. It is the cyclical nature of life from the beating rhythm of your heart, the cyclical events of the seasons, weather, movement of planets, to even how artificial gravity is created by the cyclical spin[!?!] Even the music we listen to must have a cycle or rhythm. Our 'social interaction' that we call our economy, is no different. [[On the other hand, every attempt to seperate out the 'different cycles' of the Dow Jones average, for example by Fourier analysis, have led analysts to the conclusion that the Dow Jones average is merely 'pseudo' cyclical.: normxxx]]

What Eric Jensen points out is critical to our understanding of our very ability to learn and advance as individuals. This method of acquiring knowledge applies to us as a society. Jensen explains there are differences between how our brain processes "verbal or spatial information." When we process written or verbal words in an 8 hour session there was an 80 minutes cycle for cognitive performance while the spatial task of locating points seems to cycle at 96 minutes, on average, (ibid/pg. 49).

While there is a genetic foundation for being smart, this accounts only for about half of our intelligence. In fact, a part of the brain deals with 'discrepancies' and is automatically activated when the outcome differs from our 'expectations'. This is the anterior cingulate and seems to be hard-wired to enable us to learn— acquire knowledge— through 'trial and error'. Jensen makes it clear that we also learn through 'social interaction'— or lack of thereof. 'Social isolation' is devastating to one's mental and physical health as well, (ibid/pg 95).

Even in prisons or POW camps, solitary confinement absent any social contacts is seen as a devastating punishment that can force its subjects to comply with the demands of the jailer. We are also familiar with the problem of 'infectious' group behaviors that can take the form of 'peer pressure' or imitative behavior among members of spontaneous groups ('mobs') or affiliative groups as demanded by Fascism or Communism— turn in your neighbor (or father or mother or sister or brother) if s/he says anything 'derogatory' of the government. These are forms of mental duress imposed by all forms of governments to varying degrees.

To continue reading this long essay go (HERE). It provides a broad overview of how Martin Armstrong built his model and how one should interpret its signals. He also provides thoughts on how government may use the model to better affect policy. While it doesn't contain any specific predictions, it is a fascinating read. Portions have been edited in order to make his ideas a bit clearer.

You can also access most of Martin Armstrong's recent essays at http://www.scribd.com/ (search on Martin Armstrong).

  M O R E. . .

Normxxx    
______________

The contents of any third-party letters/reports above do not necessarily reflect the opinions or viewpoint of normxxx. They are provided for informational/educational purposes only.

The content of any message or post by normxxx anywhere on this site is not to be construed as constituting market or investment advice. Such is intended for educational purposes only. Individuals should always consult with their own advisors for specific investment advice.

Saturday, April 25, 2009

Trading Volume Separates Bull Markets From Bear Rallies

Trading Volume Separates Bull Markets From Bear Rallies
Click here for a link to ORIGINAL article:

By William Hester, CFA | April 2009

All rights reserved and actively enforced.
Reprint Policy


One of the platitudes most constantly quoted in Wall Street is to the effect that one should never sell a dull market short. That advice is probably right oftener than it is wrong, but it is always wrong in an extended bear swing. In such a swing the tendency is to become dull on rallies and active on declines.
— William Peter Hamilton, The Stock Market Barometer (1909).

Volume tends to expand in the main direction of the trend. In a bull market, advances accompanied by increasing volume or declines on diminishing volume are taken to be bullish. Conversly, in a bear market, declines are accompanied by increasing volume and advances show diminishing volume. Volume should always be studied as a trend (relative to what has preceded).
— Richard Russell, The Dow Theory Today

The bottom is preceded by a period in which the market declines on low volumes and rises on high volumes. The end of a bear market is characterised by a final slump of prices on low trading volumes. Confirmation that the bear trend is over will be rising volumes at the new higher levels after the first rebound in prices.
— Russell Napier, Anatomy of the Bear (his study of the four great stock market bottoms of 1921, 1932, 1949, and 1982).

Whether it was William Peter Hamilton observing the trading activity of the 19th century, or Richard Russell who has studied the market's real-time price and volume action for more than 50 years, or Russell Napier who took the time for an in-depth review of the 4 greatest buying opportunities in the 20th century, each came to a similar conclusion: to confirm a change in market conditons, watch trading volume closely. By this measure, the market's recent rally still has much to prove.

The graphs below attempt to provide visual support to the idea that volume matters as a characteristic of a rally— especially one that is so widely annointed as the beginning of a new bull market. The graphs will hopefully also add to the comments John Hussman has made— including those in last week's Green Shoots over Thin Ice and December's Recognition, Fear and Revulsion. Specifically, bear markets don't typically end in a crescendo of fear and panic, but more often on a feeling of "despair and disillusionment," while strong bull markets tend to feature heavy trading volume.

In each of the charts below the blue dates represent the beginning of each bull market since 1940. The red dates represent this decade's bear-market rallies, including 4 during the 2000-2003 bear market and the rally that lasted from November of last year through January.

In the first graph below, the vertical axis shows the 4-week percent change in the S&P 500 beginning a month prior to each trough in the market. It attempts to capture how sharp the final move was to the low. The horizontal axis shows the 5-week change in the S&P 500 off of the bottom. It attempts to measure the intensity of the rally that followed.

Data that fall in the upper left portion of the graph represent periods where the market bottomed with little fanfare, and the rally that followed was similiarly uninspiring. Data that fall to the bottom right represent periods where a sharp rally off of the bottom approximated the severity of the preceding decline.


Click Here, or on the image, to see a larger, undistorted image.


To some extent, all stock market bottoms carve out a ‘V' bottom. Prices move lower, and then change direction. But look at the clump of blue data points in the upper left portion of the graph. These aren't the capitulations that most investors have in their minds when they think of a classic bear-market V-bottom. The bulk of bear markets have ended by falling less than 10 percent in the final month— and were followed by similiarly modest moves off of the bottom.

There are exceptions which include 1987 and 1998. But those corrections were sharp and condensed. Even so, they were both followed by tepid rebounds in the initial upswing.

Look at the bear-market rallies in red. The characteristic that these periods share is that they frequently carve out an acute bottom— a capital ‘V' to the typical bear-market bottom's lowercase ‘v'. In each of the 5 cases, a sharp condensed decline created an oversold condition, which was then followed by a similarly powerful rally.

Since it's unknown whether the recent advance is a rally within a bear market or the beginning of a new bull market, the market's performance in 2009 is denoted in orange. It sits far away from the blue data points, and shares its space with the 5 previous bear-market rallies. And while much has been said about the strength of the rally this year, the graph shows that it's consistent with the severity of the decline that preceeded it. The S&P 500 fell 26 percent from it's peak in January to the March low. It's rallied since March by roughly the same amount.

This is not to say that the market never rallies strongly at the beginning of a bull market. During the first weeks of the bull markets beginning in 1971, 1982, and 2003 the market rallied impressively in a short period of time. But an important distinction is that the approach to their final lows was distinguished by a more moderate decline when compared with each bear market rally.

Missing Volume

The second characteristic of a trustworthy bear-market bottom is that the rally that follows tends to coincide with a healthy increase in volume. The chart below again shows all of the bear-market bottoms since 1940 in blue and the 5 most recent bear-market rallies in red, along with this year's advance. This time the vertical axis measures the 5-week percent change in the S&P 500 from each bottom. The horizontal axis measures the 5-week percent change in NYSE volume (smoothed). The two dotted lines group the data into three separate areas.

Data points that fall in the upper left portion of the graph represent powerful rallies on contracting volume. Data points that fall in the lower right portion of the graph represent steadier advances with increasing volume or slightly contracting volume. The lower left portion represents bull-market bottoms that began with contracting volume.


Click Here, or on the image, to see a larger, undistorted image.


It appears that bear-market rallies like to stick together. Here you can see the characteristics these rallies share include strong (even if temporary) returns with contracting volume. Each had strong returns within the first 5 weeks of the rally— and most went on to gain more than 20 percent before rolling over. But it's important to note that volume waned during each of these rallies. And for the most part, the larger the contraction in volume, the more quickly the rally tended to lose steam.

The characteristics of this year's rally are interesting. It's the strongest 5-week rally over the entire data set— even with contracting volume. One positive we can note is that the volume is contracting on this rally less than it contracted in last year's bear-market advance. But the market has also run up strongly on volume that would be unusually weak for a bull market advance of this size.

You can see what most initial bull advances look like in the lower right part of the graph. Except for 1982 and to a lesser extent 1971 and 2003, bull markets tend not to be explosive in their first couple of weeks. And when they are, the moves tend to coincide with a similarly explosive increase in volume. NYSE volume grew by 40 percent in the first 5 weeks or so off of the 1982 bull market. At an S&P 500 dividend yield of nearly 7%, stocks were cheap and investors showed their conviction.

This is not to say that bear-market bottoms can't occur on low or contracting volume. They can, as is shown in the lower left portion of the graph. The bear-market bottoms of 1957, 1962, 1970, and 1987 all began with unimpressive amounts of volume. But they also share another characteristic— early returns were muted. The bull markets that did begin on low volumes didn't have explosive beginnings.

Recruiting Volume

If March 6th proves to be the bottom of the market, Anatomy of the Bear author Russell Napier can put off his next edition for awhile because the most recent bear market won't qualify as a great bottom. That's because even though the market's decline since 2007 has been one of the largest on record, it didn't bring the market to truly great values. In his analysis of the stock market bottoms of 1921, 1932, 1949, and 1982 Mr. Napier chose to use two measures to gauge the valuation of the market.

One was Robert Shiller's PE ratio based on trailing earnings. As I noted in Market Valuations During U.S. Recessions, this ratio has fallen to the mid-single digits during periods of extreme undervaluation. It's currently 15. The second valuation tool Mr. Napier used was the q-ratio, a measure of market valuation relative to the replacement cost of assets. Deep undervaluation for this measure tends to be when market prices are roughly 35 percent of replacement costs. According to the most recent data the q ratio is about twice that.

An important observation that Mr. Napier makes in his studies of the most damaging bear markets is that even if the initial move off of the bottom is lacking volume, once a new higher level is reached, the market should begin to attract buying interest. In each of the bottoms he studied, volume expanded noticeably after the initial rally. This idea also holds up for the majority of bear-market bottoms. In the graph below the axes are the same as the graph immediately above. The vertical axis shows the percent change in the S&P 500 while the horizontal axis shows the percent change in volume. But this time the period is 6 months from each bear-market bottom.


Click Here, or on the image, to see a larger, undistorted image.


The line that fits the data slopes upward, implying that the more robust a rally is during the first six months, the better the improvement in volume. Here the bear-market bottoms of 1982 and 1974 stand out. Both provided strong returns that coincided with equally impressive improvements in volume. The periods of 1974 and 1982 are examples where ‘revulsion' and deep undervaluation can combine to create a powerful base from which bull markets launch.

Contracting volume is not enough evidence to qualify that this is a bear-market rally with certainty. There are other measures that are showing more strength— such as various indicators of market breadth. [[But, on the other hand, this market has been marked by unusual wide (negative) market breadth on the way down.: normxxx]] But new bull markets, whether at their inception or soon after, have a history of recruiting noticeable improvements in volume. So far this rally lacks that important quality. Over the next few weeks stock market volume will be a metric to watch closely.

The Predictions Of A Hedge Fund Manager

The Predictions Of A Hedge Fund Manager: Yet Another Cassandra
Click here for a link to ORIGINAL article:

By Nicholas A. Vardy, Global Dividend Opportunities | 25 April 2009

With global stock markets rallying sharply since early March, the mood on Wall Street has shifted remarkably quickly. Recognizing the importance of "Animal Spirits" to the global economy, the U.S. government seems now engaged in a full court press to increase confidence in the financial markets. Investors who bought Citigroup (NYSE: C) and Bank of America (NYSE: BAC) a couple of weeks ago have seen the price of their investments double. Greed has overtaken fear in the markets virtually overnight. The question on everyone's lips is: "Can it last?"

This past weekend, I had the opportunity to spend some time with a few of the biggest names in the hedge fund world. One made more money in 2005 than many small investment management companies have under management. Equally importantly, at one point in his career, he had almost lost it all. So he has the invaluable perspective of someone who has both won and lost big— and of someone who had invested in countries where he learned how governments and individuals behaved in times of crisis.

He made a handful of predictions, most of which put him squarely in the Cassandra camp.

1. All large European banks will go bankrupt. Their "Tier 1" capital levels simply aren't high enough to absorb all of the bad loans they had made to overheated European economies like the "PIGS" (Portugal, Ireland, Greece and Spain) and profligate new EU members like Hungary and Latvia. The price at which the debt of these banks is trading already confirms that their equity capital is wiped out. As a result, European banks will "gate" their deposits by limiting depositors from withdrawing their money from banks to say, 1,000 euros a week.

2. At least one European country will go bankrupt over the next 12 months. Individual countries simply do not have the reserves to deal with a run on the banks. And unlike the United States or the United Kingdom, eurozone countries can't print money at will. If the French wake up one Monday morning and see that the Irish are unable to withdraw their money from their banks, it won't be long before the French are queuing up for their money. The panic will spread like wildfire.

3. The enormous borrowing required to finance the Obama administration's deficit means that interest rates on U.S. Treasuries are set to soar [[but not necessarily anytime soon: normxxx]]. All the government efforts are in vain anyway. And anyone who is in political office now will be out soon— whether by coup in the third world or by elections in the developed world.

4. The Chinese economy is toast. With 45% of its economy relying on exports, China has never been much more than a workshop for Wal-Mart. With U.S. consumers re-trenching— traffic to ports in Southern California is down 35%— the Chinese have little to offer to the world. Even Russia is better off. At least it has natural resources— money it can suck out of the ground.

5. The recent market action is a sucker's rally. Gold is the only safe haven. The price of gold is set to soar. [[Gold can always be confiscated, one way or another. A safer bet may be to invest in non-PM (base) metals such as copper (which is probably way too high at present, if these warnings come to pass) and oil (which could go down to $35 bbl or even less).: normxxx]] Call the Union Bank of Switzerland (UBS), buy physical gold and store it in a safe. (One caveat: UBS is one of the European banks that is expected to go bust.)

The Predictions Of A Hedge Fund Manager: Do As I Do, Not As I Say

Yogi Berra famously opined that "predictions are hard, especially about the future". But Berra was wrong. Making predictions is easy. It's making money from those predictions that is hard.

Consider the case of our hedge fund manager. You'd think that if he were so convinced of his opinions, he'd put his money where his mouth is. He would short European banks, short the euro, short U.S. Treasuries, short China and be long on gold. Perhaps he has done all those things. But he is also 90% in cash.

But don't hold it against him. Unlike most people who make predictions for a living, he has been through the experience of losing 98% of his money. When he is offering his opinions, he knows that he is playing a different game. He knows that his punchy views will get him attention. But when it comes to managing $4 billion of other people's money in highly uncertain times, he knows when it's best to just sit on the sidelines [[especially when one must factor in the always tricky actions of politicians acting in panic: normxxx]].

The Predictions Of A Hedge Fund Manager: Do As I Say, Not As I Do

Pundits with strong opinions attract attention. After all, when a boring corporate type speaks, most people can barely stay awake. And as any on-air financial commentator will tell you, the biggest sin isn't to draw the ire of critics. The biggest sin is to be ignored.

Contrast our hedge fund manager's investment strategy with that of New York University's Nouriel Roubini, aka "Dr. Doom". Roubini agrees that the recent rally is a "dead cat bounce or bear market sucker's rally." Yet, as reported in the Financial Times, Roubini's own investment strategy has been to be 100% long, invested in index funds. But you have to wonder why.

If Roubini saw the global financial system as the Titanic hitting the iceberg, why did he sit back and watch his 100% long portfolio get cut in two? The disconnect is almost bizarre. But it illustrates the difference between offering predictions— and making money. Strong opinions are terrific. But making money is even better.

When someone whose opinion you agree with has lost 80% of your money, it can wear thin when he still insists, "I wasn't wrong. I was early". That's why predictions are worth taking with a grain of salt. Eighteen months ago, the U.S. dollar, the Iranian president declared, was a "worthless piece of paper." A year ago, Goldman Sachs' chief economist predicted that thanks to "decoupling," China would bail out the world economy. Nine months ago, Russian oligarchs were predicting $250 dollar a barrel oil as they were lighting their cigars with 500 euro notes.

All of those predictions turned out to be spectacularly wrong. The greatest speculator in the world, George Soros, has literally written entire books that were chock full of predictions gone awry. In fact, almost every one of his predictions for 2008 was wrong (see my analysis on video here). Yet Soros managed to eke out a 10% gain, while other big name hedge funds struggled like never before. That's the difference between managing money— and just talking about it.

  M O R E. . .

Normxxx    
______________

The contents of any third-party letters/reports above do not necessarily reflect the opinions or viewpoint of normxxx. They are provided for informational/educational purposes only.

The content of any message or post by normxxx anywhere on this site is not to be construed as constituting market or investment advice. Such is intended for educational purposes only. Individuals should always consult with their own advisors for specific investment advice.

Friday, April 24, 2009

Crony Capitalism, U.S. Style

Crony Capitalism, U.S. Style: Wall Street vs. Main Street
Guess Who's Winning!?!
The New Financial Overlords: The Debt Class And Those That Provide The Debt For The Serfs. Understanding The New Structure Of The American Financial Landscape.


Click here for a link to ORIGINAL article:

By DrHousingBubble | 19 April 2009

The stock market at least in its current form is a horrible indicator of the actual economic carnage falling upon the majority of Americans. Most Americans are witnessing the current rally and wondering why the massive run up (largely in financial related stocks) is going forward while they are getting called into supervisor offices behind closed doors and being laid off or seeing their hours cut back. Wall Street has completely disconnected from Main Street.

It is also hard for many to understand how they are having their limited income taxed to finance the bailouts of Wall Street and its financial cronies while they are asked to do more with less. They are seeing these same institutions, alive only because of the massive funding from the American people, nevertheless shut off credit lines and raise rates while the government through the U.S. Treasury and Federal Reserve showers the banks and Wall Street with easy low rate financing thanks to the American taxpayer. And our government ideally should reflect the will of the majority?

Welcome to the new America. Where unemployment is good news for Wall Street and bailouts are now seen as a new source of revenue for financial companies. New accounting students will learn how to incorporate bailout funds as a new source of revenue.

It is easy to turn a profit as a financier when trillions are funneled into the financial system. This is like jumping into the blue ocean and being shocked you got wet. Yet the problem of course is very little of this money is trickling down to the real economy— you know, that economy that doesn’t involve Bloomberg Terminals and pinstripe suits? Imagine a giant person eating at a table and the mice are running around on the floor hoping to pick up the scraps. Guess who the mice are?

The last few weeks have been great for the financial companies because they are now operating in a pseudo reality that is for the privileged few. These are the new financial overlords and all it took was the collapse of debt to show them for what they truly are. Many people for the last few decades have confused debt with actual wealth. That is a mistake we are now coming to terms with.

Many families now are seeing $5,000 in credit card debt at a reasonable rate— that has suddenly jump to double or more, just because the banks have— willy-nilly— decided to change terms. They are doing this on a massive scale while simultaneously cutting the credit lines of many Americans (and adding penalty fees if the used credit is not instantly brought within the new limits). Just to highlight this split, let us look at the unemployment numbers released for California on Friday, 17
April:


Click Here, or on the image, to see a larger, undistorted image.


The unemployment rate for California is now 11.2%, the highest on record. While the markets are rallying states are reporting higher and higher unemployment rates. In California, this translates to 2,131,200 unemployed and the trend is moving still higher. Most Americans would say that their biggest source of income is their job.

So how can an economy be healthy if people are losing jobs and unemployment is breaking all records? Again, the small elite circle of financial kingpins are squeezing the debt laden serfs to pay as much as they can even though they are confronting one of the worst employment markets in history. And the government has been throwing money at this problem for many months now.

The TARP was created in the fall of 2008 and that has been an abject failure. Remember that most officials have been saying that it has been crucial to stabilize the housing market. You would think that $12 trillion in committed bailout funds would at least stem some foreclosures. In fact, the opposite has occurred. The latest data shows foreclosures breaking all time records:


Click Here, or on the image, to see a larger, undistorted image.


Even with all the moratoriums, incentives to banks, and other smoke and mirrors, foreclosures keep on moving up— meaning more and more Americans are losing their homes. So what have all those bailouts accomplished? They have kept the banking feudal lords sitting pretty while the rest of country finances their massive losses.

I hesitate even to call this 'corporate welfare' because many corporations have also to face the grim reality like the rest of us non-bankers. I call this crony financial capitalism run by a small group of plutocrats. If you are looking at the stock market as some sign of the overall health of the economy you are really looking in the wrong place.

So what has happened to the income of most Americans? Let us take a look:

Keep in mind the above data does not include the destruction of $11.2 trillion in financial wealth because of 2008. Even without that cold hard fact, American families overall have seen their income not only stagnate, but go negative when adjusted for inflation. So who has done well in the last decade?


Click Here, or on the image, to see a larger, undistorted image.


While most families have seen their income move sideways or decrease, the top 10 percent of wage earners have seen gigantic shifts in their income upward. Even with the top 10 percent, you see most of it being skewed by the top 5 percent of all incomes. And the more money you have, the less you depend on wages:


Click Here, or on the image, to see a larger, undistorted image.


So while 90 percent of Americans depend on their wages for 70 percent of their income or higher, the top 10 percent of wage earners only depend on wages for 46 percent of their income, a drop from 53 percent in 2004. What does this mean? They get more money from 'passive' sources.

Passive sources like fleecing the 90 percent of American taxpayers to make sure their bond income or stock portfolio pays enough in dividends so they don’t have to mix out there with the other 90 percent of poor schmucks trying to make a living. And keep in mind, those at the higher end of the curve are not part of that elite group. Let us look at the income break down for the U.S.:


Click Here, or on the image, to see a larger, undistorted image.


In order to be in the top 10 percent your household will need to bring in $118,200 or more. Here in California that is basically a household of two working professionals. But given the high unemployment rate, the number of such families here is decreasing. I would argue that you will see a bigger difference if you look at household incomes of more than $200,000. That is where the separation begins.

The problem with the current system is the abject hypocrisy. Most Americans for the most part, believe in the basic tenets of capitalism. Competition. Supply and demand. But here you have a system that does not favor competition. In fact, the top five banks control upwards of 60 percent of all banking. How is that competition?

How about AIG posting the biggest quarterly loss in history? Their punishment is having to accept more money. In addition, the core belief of competition is that the best businesses will survive and thrive. In our current environment, we are rewarding the worst and most corrupt businesses. It is contrary to everything most have been told.

That is why we are seeing such anger and frustration out in the country. Wall Street and the politicians (who were in bed with them) can’t admit to what is going on, but if you have two eyes and a bit of logic, you will realize that all we have been doing is transfering wealth from the majority to a tiny minority. To show this even clearer, look at the income growth over the last 70 years for the various brackets:


Click Here, or on the image, to see a larger, undistorted image.


It would be one thing if the top earners made their money from solid businesses producing things of value for the majority. There are many that did do this. But there is also a huge number that created their wealth through AIG, Lehman Brothers, Fannie Mae and Freddie Mac, and other complete business failures. Many hedge funds thrived because they placed bets on casino like profits in finance and real estate.

If you want to see who the biggest failures are just look at the TARP recipients— yet they are the companies gaining most benefit from the current rally. They are all trying to prance around in this parade with their first quarter 'profits'— but those are thanks to the taxpayer, not them. If it wasn’t for the bailouts [[and a quick change in the accounting rules by FASB to allow them to further hide their losses: normxxx]], they would be in bankruptcy themselves. As they would, if they didn’t have control of an oligarchical system of finance.

The best course of action should have been receivership. [[But, of course, that is NOT possible. "w" and his minions largely saw to it that any government capability to act independently of the bankers and Wall Street was deleted from government— you are talking about a handful of largely low-level 'regulators' left to handle many hundreds of banks and other financial institutions (a task that would likely take thousands of regulators as long as a decade).: normxxx]]. But that would cut into this 'select' group of people and their income so we couldn’t do that.

Therefore the next logical step was to snow the masses into believing the world would end if we didn’t step in [[as well it might— they've seen to that! : normxxx]] They should have qualified that their financial world would have ended which isn’t necessarily a bad thing. But, since the government has 'stepped in', unemployment has been skyrocketing, foreclosures are at all time highs, and we are to believe that this is good for us? For many people things are ending: jobs, home ownership, healthcare, families, etc.

And even amongst the wealthy, there is a caste system:


We can throw in a few hedge fund managers and bond managers in this group. Ultimately, the system is flawed. Most Americans have been under the illusion that they were wealthy. They are not. In fact, we can pinpoint this decline on a graph:


Click Here, or on the image, to see a larger, undistorted image.


Starting in the 1970s, we began to see a massive decline in the savings rate and an explosive jump in consumer debt. Debt per se isn’t bad. In fact, for nearly 50 years the 30 year fixed mortgage served us well when borrowers came in with a down payment (which they had saved). That all changed of course. Now, debt was being used as a supplement for the lack of real wage growth.

It was like a fake Hollywood set. It was only a matter of time before we walked up to the cutout of a building and pushed it over. Time to put that Fiji vacation on the credit card. Let us put the Jacuzzi on the American Express. Time to put those breast implants on the card. 'Credit' (a nicer name for debt) was used for everything and anything. And that was the problem.

Debt was permitted to all with the implicit notion that if everything went boom, the government would step in to backstop it. No one explicitly said this, but the inner circle 'knew' this. Everything has gone boom and here the government is bailing out decades of frivolous spending financed by the loan sharks on Wall Street. As a society we setup the environment to create Frankensteins like Bernard Madoff.

He got away with it for so long because the system rewarded people like him. He merely played the game better than most. Don’t hate the player, hate the game. There are many that are worse than Madoff but they played within the 'rules' [[in particular, he made the mistake of robbing too many rich people: normxxx]]; therefore everything is fine. But is it? Is this the kind of system we want where gains are privatized and losses are socialized onto the backs of the population?

I know many people are screaming about socialism now, but they are late to the game (like a few decades late). Also, what exactly is the mass of the population getting for this new expensive socialism? Employment security? Healthcare? If this is socialism we are getting very little out of it. For a history lesson, Mussolini’s government was supported by the military, the business class, and the extreme wings of the political branches. Sound familiar?

In fact, in 1935 Mussolini pushed for government control of business. By 1935 nearly 75 percent of Italian business was under state control. We have AIG, Fannie Mae and Freddie Mac, all the TARP banks, and what else? We definitely do not want to go down this path. Are we looking at Japan and there 2 lost decades as an example? The crowd that is getting silenced here is the moderate majority.

In fact, I talk with both moderate Democrats and Republicans and we have more in common than many think. Yet you have the extreme wings of both parties hijacking the issues. Like the tea parties that started with anger toward the bailouts. Many protesters added other wedge issues having nothing to do with the bailout. These latter are distractions. Keep your eye on the ball. The first news station that does a two hour piece shredding the Fed and U.S. Treasury gets a massive high five (hint hint CNBC).

The current administration has two widely respected financial experts in Paul Volcker and Elizabeth Warren. Both should be unleashed on the financial industry. Last I heard is they are putting Volcker on the task of reforming the tax code which is incredibly important. But why not have him tackling the current banking crisis as well? He can walk and chew gum.

Elizabeth Warren showed up on The Daily Show and said all the right things. Yet when John Stewart asked her what her power was, she really couldn’t say. All she could say is "I talk about it." What use is 'transparency' without the ability to act on what you find? Now I realize a fiscal problem 30 years in the making won’t be fixed in 3 months, but I do hope we start seeing some progress in protecting the American people because, ultimately, we are all going to pay dearly (as many already have) if we continue down this path.

The bottom line is there is a two class system in the U.S. and it doesn’t separate along party lines. Those that rely on and use debt and those that create it with the aid of the government (aka Wall Street). Banking should be a utility that provides capital for the most efficient resources. That is it.

Banks should not be seen as a large segment of the economy for either employment or wealth earning purposes. They are like a parasite that depends on the host growing ever larger. Now that defaults are hitting (and the host has taken to shrinking rather than growing), they are looking for a new vector and new ways to feed— so now they have latched onto the government as a more direct way to feed off the masses (via the taxpayers). There was a reason banking became a boring enterprise after the Great Depression.

If we learn any lessons from our Great Recession, banking will go back to being a boring, highly controlled, and tiny part of our economy. In the meantime, enjoy the stock market rally for the feudal lords while unemployment keeps skyrocketing for the serfs. During the Irish Famine, the feudal lords of Ireland were a net exporter of food, while potatos rotted in the field and whole families starved to death or set sail for America. Where is America's America?


  M O R E. . .

Normxxx    
______________

The contents of any third-party letters/reports above do not necessarily reflect the opinions or viewpoint of normxxx. They are provided for informational/educational purposes only.

The content of any message or post by normxxx anywhere on this site is not to be construed as constituting market or investment advice. Such is intended for educational purposes only. Individuals should always consult with their own advisors for specific investment advice.

Tuesday, April 21, 2009

Housing Bubble Smackdown

Housing Bubble Smackdown: Bigger Crash Ahead
Click here for a link to complete article:

By Mike Whitney | 21 April 2009

Due to the lifting of the foreclosure moratorium at the end of March, the downward slide in housing is once more gaining speed. The moratorium was initiated in January to give Obama's anti-foreclosure program— which is a combination of mortgage modifications and refinancing— a chance to succeed. The goal of the plan was to keep up to 9 million struggling homeowners in their homes, but it's clear now that the program will fall well-short of its objective.

In March, housing prices accelerated on the downside indicating bigger adjustments dead-ahead. Trend-lines are steeper now than ever before— nearly perpendicular. Housing prices are no longer falling— they're crashing and crashing hard. Now that the foreclosure moratorium has ended, Notices of Default (NOD) have spiked to an all-time high. These Notices will turn into foreclosures in 4 to 5 months time creating another cascade of foreclosures. Market analysts predict there will be 5 million more foreclosures between now and 2011.

The New Condo Reality
A reader wants to buy a condo in a building optimistically described as 'half-full.' A WSJ columnist reflects on the wisdom of such a move.


  M O R E. . .

It's a disaster bigger than Katrina. Soaring unemployment and rising foreclosures ensure that hundreds of banks and financial institutions will be forced into bankruptcy. 40 percent of delinquent homeowners have already vacated their homes. There's nothing Obama can do to make them stay. Worse still, only 30 percent of foreclosures have been relisted for sale suggesting more hanky-panky at the banks. Where have the houses gone? Have they simply vanished?

600,000 "Disappeared Homes?"

Here's a excerpt from the SF Gate explaining the mystery:

"Lenders nationwide are sitting on hundreds of thousands of foreclosed homes that they have not resold or listed for sale, according to numerous data sources. And foreclosures, which banks unload at fire-sale prices, are a major factor driving home values down. 'We believe there are in the neighborhood of 600,000 properties nationwide that banks have repossessed but not put on the market,' said Rick Sharga, vice president of RealtyTrac, which compiles nationwide statistics on foreclosures.

'California probably represents 80,000 of those homes. It could be disastrous if the banks suddenly flooded the market with those distressed properties. You'd have further depreciation and carnage.'

In a recent study, RealtyTrac compared its database of bank-repossessed homes to MLS listings of for-sale homes in four states, including California. It found a significant disparity— only 30 percent of the foreclosures were listed for sale in the Multiple Listing Service. The remainder is known in the industry as "shadow inventory." ("Banks aren't Selling Many Foreclosed Homes" SF Gate)

If regulators were deployed to the banks that are keeping foreclosed homes off the market, they would probably find that the banks are actually servicing the mortgages on a monthly basis to conceal the extent of their losses. They'd also find that the banks are trying to keep housing prices artificially high to avoid heftier losses that would put them out of business. One thing is certain, 600,000 "disappeared" homes means that housing prices have a lot farther to fall and that an even larger segment of the banking system is underwater.

Here is more on the story from Mr. Mortgage "California Foreclosures About to Soar...Again"

"Are you ready to see the future? Ten’s of thousands of foreclosures are only 1-5 months away from hitting that will take total foreclosure counts back to all-time highs. This will flood an already beaten-bloody real estate market with even more supply just in time for the Spring/Summer home selling season… Foreclosure start (NOD) and Trustee Sale (NTS) notices are going out at levels not seen since mid 2008. Once an NTS goes out, the property is taken to the courthouse and auctioned within 21-45 days… The bottom line is that there is a massive wave of actual foreclosures that will hit beginning in April that can’t be stopped without a national moratorium."

JP Morgan Chase, Wells Fargo and Fannie Mae have all stepped up their foreclosure activity in recent weeks. Delinquencies have skyrocketed foreshadowing more price-slashing into the foreseeable future. According to the Wall Street Journal:
"Ronald Temple, co-director of research at Lazard Asset Management, expects home prices to fall 22% to 27% from their January levels. More than 2.1 million homes will be lost this year because borrowers can't meet their loan payments, up from about 1.7 million in 2008." (Ruth Simon, "The housing crisis is about to take center stage once again" Wall Street Journal)

Another 20 percent carved off the aggregate value of US housing means another $4 trillion loss to homeowners. That means smaller retirement savings, less discretionary spending, and lower living standards. The next leg down in housing will be excruciating: every sector will feel the pain. Obama's $75 billion mortgage rescue plan is a mere pittance; it won't reduce the principle on mortgages and it won't stop the bleeding. Policymakers have decided they've done enough and are refusing to help. They don't see the tsunami looming in front of them plain as day. The housing market is going under and it's going to drag a good part of the broader economy along with it. Stocks, too.

Real Homes of Genius: It Takes a Pink Home to Lose 80 Percent in Value. 3 Sample Compton Homes Showing the Magnitude of the Housing Bubble and Subprime Mess. Going back to 1990 Prices.


Click Here, or on the image, to see a larger, undistorted image.


Click Here, or on the image, to see a larger, undistorted image.


  M O R E. . .


Normxxx    
______________

The contents of any third-party letters/reports above do not necessarily reflect the opinions or viewpoint of normxxx. They are provided for informational/educational purposes only.

The content of any message or post by normxxx anywhere on this site is not to be construed as constituting market or investment advice. Such is intended for educational purposes only. Individuals should always consult with their own advisors for specific investment advice.

Monday, April 20, 2009

Why I Fired My Broker

Why I Fired My Broker

By Jeffrey Goldberg, Atlantic | 20 April 2009

With his 401(k) in ruins, our correspondent visits investment gurus, hedge fund managers, and a freakish Arizona survivalist with one question in mind: How can the ordinary investor recover?

For most of our adult lives, my wife and I have behaved in the way responsible cogs of capitalism are supposed to behave— we invested in a carefully calibrated mix of equities and bonds; we bought and held; we didn’t overextend on real estate; we put the maximum in our 401(k) accounts; we gave to charity; and we saved, but we also spent: mainly on gasoline, food, and magazines. In retrospect, we didn’t have the proper appreciation for risk, but who did? We were children of the bull market.

Even at its top, my investment portfolio was never anything to write home about. Its saving grace was that it was mine. And I imagined that when we did cash out, at 60 or 65, I would pass my time buying my wife semisubstantial pieces of jewelry and going bass fishing like the men in the Flomax commercials.

Well, goodbye to all that. I took a random walk down Wall Street and got hit by a bus.

How sure am I it’s goodbye? The signs are rampant, but one has become stuck in my mind: a video of Richard Bernstein, the chief investment strategist for Merrill Lynch (sorry, I mean the Merrill Lynch division of Bank of America, which, by the time you read this, may be the Bank of America division of the United States Government), advising Merrill clients such as myself that one of the best financial strategies to adopt now would be to extend my "investment time horizon."

"If one were to trade the S&P 500 for one day, the probability of losing money is about 46 percent," Bernstein states. "However, as one extends that time horizon from one day to one month to one quarter to one year to 10 years … [[to 20 years, to … there have even been a few 20 year periods with negative returns (cap gain plus dividends), inflation adjusted: normxxx]], the probability of losing money decreases as the time horizon lengthens."

To which I would add this observation from Keynes: "In the long run, we are all dead."

This is what I heard Bernstein say: give up. You’re not going to make money on your investments in the next 10 years, or 15, or 20, so you should stop worrying about your portfolio and go to the movies like everyone else. I called Bernstein and asked him if he was, in fact, advocating a form of Stoicism.

He said I was misinterpreting his views. "This is not some sort of psychological compensation device. What I’m saying is that in looking for investment ideas, we should be looking over a five, six, seven-year time period. You have to give an investment strategy time to reach gestation."

But my investment strategy gestated for 15 years. And then it died.

As I write this, the markets are back down to 1997 levels. In Japan, they’ve sunk to 1983 levels. I pointed out to Bernstein that 1983 was 26 years ago. The investor who bought Japanese equities in 1983 and held on to them has stayed absolutely flat. "That’s not correct," Bernstein said. "That doesn’t take into account dividend payments." [[It also doesn't take inflation into account!: normxxx]]

Even with all those munificent dividend payments, my net worth has dropped by a third, and new vistas of worry open up for me each day. I’m not complaining, by the way, and not only because I have no right to complain. I make more money than most Americans. I will ungrudgingly pay more taxes if it means keeping people in their homes— even the schmucks in overleveraged McMansions.

My wife and I are lucky. We have substantial equity in a small but perfectly nice house in Washington, D.C., a city that is now, among other things, America’s financial-services capital, which should help keep real-estate prices steady. I have a late-model minivan. Most important, I have a job (and in the thriving magazine industry, no less!).

If I lose my job, then I’ll complain (at which point, of course, I’ll no longer have a public venue for my complaints). But for now, no whining: just confusion and bemusement and fear, along with an uncharacteristic sense of paralysis. In the past six months, I’ve bought and sold virtually no equities. And I rarely take the pulse of my 401(k).

I called a psychologist to find out what could explain this weird passivity. Daniel Kahneman is a Nobel Prize–winning innovator in the field of behavioral economics. He explained that my feelings of paralysis were to be expected.

"You no longer know the world you live in," he said. "You played by the rules, the rules benefited you. The world functioned according to some regularities. Right now, it’s unclear what rules apply. There is a new regime. What seemed prudent earlier has disappeared."

"I’m surprised Americans aren’t more panicked. Americans seem to accept a level of insecurity in their lives that Europeans couldn't/wouldn’t tolerate. Paralysis is one response to this level of insecurity."

This might explain why my wife and I have taken no action to fix our finances. Although it’s also the case that we haven’t heard from our Merrill broker in nine months. The last time he called was well before the day in September when the government encouraged the shotgun sale of Merrill to Bank of America, to keep Merrill from collapsing.

I should have seen the signs of dysfunction much earlier. It was more than a decade ago that our first Merrill Lynch adviser put us in a company called Boston Chicken. A Merrill analyst described it as "the restaurant concept of the ’90s." It went bankrupt in 1998.

Only later did I learn that Merrill had underwritten the initial public offering for Boston Chicken stock, and so had an interest in selling the company to its customers. There were other brilliant pieces of advice— long-term "buy and hold" recommendations that emerged from the Merrill analysis factory: Qualcomm; Sun Microsystems; Nokia; and Citibank, of course, which has recently dipped as low as a dollar a share. The 'full-service' trading fees at Merrill— $80, $100, $130, for modest chunks of stock— were high, but we were told that we were paying 'a premium for quality research'.

In many cases, we were. Bernstein, the chief strategist, has actually been bearish for much of the past decade. Given his recent disposition toward market pessimism, I asked him why he didn’t tell Merrill’s clients to dump their equities seven months ago. "I said it as best as I could within reasonable professional standards," he said. "I’m not going to yell ‘Sell, sell, sell!’ I’m not going to go out and be irresponsible."

I imagine that many of Merrill’s clients are now wishing that Bernstein had been more irresponsible. Of course, even if he had said something louder, my financial adviser might not have relayed the message. [[And/or he (Bernstein) could have gotten fired, like so many other bearish 'analysts'.: normxxx]] But I hadn’t depended solely on Merrill Lynch for advice. I believed I could find investments for myself.

I stayed away from mutual funds because I couldn’t figure out who ran them. And I applied Warren Buffett’s famous dictum— "Don’t buy something you don’t understand,"— to my trading, so I bought, in our Merrill Lynch account, such companies as Johnson & Johnson and Procter & Gamble and Illinois Tool Works and Caterpillar, and these had been kind to us, until now. (I also bought the Internet company Ariba, because I heard about it from a guy who heard about it from a guy. It went up to about $1,000; I didn’t sell, of course, and now it’s at $8-9.)

And every so often, I would follow the recommendations of the financial magazines— SmartMoney in particular, because for a long while I was an ardent consumer of financial pornography. No more. In the harsh light of recession, I find it hard to believe I listened to a magazine that, in August 2007, recommended American Express at $63 a share (a "conservative way to make hay from global credit-card growth"), which as I write this is selling for $13-19 a share; Wynn Resorts, $94 then, $30 now; HSBC, $93 then, $34 now; Washington Mutual, $36 at the time, seized by the government last September— rendering the stock worthless.

It turns out that my crucial mistake was believing that the brokers and wealth managers and cable-television oracles who make up the financial-services industrial complex actually had my best interests at heart. Or so say the extremely smart— and wealthy— people I asked to help me figure a way out of my paralysis. One of these people was Robert Soros, the deputy chairman of the fund started by his father, George. I went to see him at his office, where he spent two hours performing an autopsy on my assumptions.

"You think a brokerage should be a place you go to pay commissions for fair and unbiased advice, right?" he asked.

"Yes," I said.

"It’s not. It never has been." He then cited another saying of Buffett’s: "‘Wall Street is a place where whatever can be sold will be sold.’ You are the consumer of their dreck. What they can sell to you, they will sell to you."

"But they told us— "

"They lied."

He went on: "You should be disheartened and disappointed. But don’t kid yourself. You’re a naive capitalist. They were never your advisers. Do not for a moment think that a brokerage firm is your friend."

"So who’s my friend?"

"You don’t have one. This is the market."

"Okay, that’s Merrill Lynch. What about the others?"

"They’re not your friends," repeated Soros patiently.

"What about Chuck Schwab?"

"All brokers move products based on volume and commission," he said.

I had a benevolent, advertising-induced understanding of Schwab. It was the billboards: "I’ve got a lot less money. And a lot more questions. Talk to Chuck." And: "It’s not just money. It’s my money. Talk to Chuck." I thought that perhaps Schwab, a discount broker, might be able to answer the question Soros could not: Why had my full-service financial adviser stopped calling me?

I did what I was told, and called Chuck. His spokesman intercepted the call. I explained that I was trying to understand the role financial advisers play in the life of the small investor, but the spokesman, Greg Gable, said that Chuck would not, in fact, talk. "We’re not going to be able to help you out," he said.

Finally, I went to another highly successful financial adviser, named Larry Gellman, who is an iconoclast and a critic of his industry. He came up with a plausible reason why Merrill did not actually seem to care about my financial future, or the financial future of my children. "Throughout the late 1990s, investors were firing their brokers and money managers because they didn’t own enough tech and Internet stocks, so everybody got loaded up at the tech party right before the cops came," Gellman said.

"Most of them were busted and never even got a drink. Some of them got lawyers and came after their brokers. So the brokerage firms all came away saying, ‘Never again.’

"If the head of Merrill Lynch and every other investment firm had their way," he continued, "no individual broker would recommend an individual stock or bond to a 'retail' client ever again. They have essentially gotten out of the brokering-and-advising business and gone all in on the ‘wealth management’ business. The new model is to gather assets from wealthy people and then place those assets with a whole bunch of managers who will manage different pieces of it in diversified styles so you don’t lose it all at once. And by the way, people with less than $10 million need not apply.

"People like you are in a sort of purgatory because no one will ever come out and tell you that he doesn’t want your business anymore," he said. "You had to figure that out by yourself." There’s quite a bit I have to figure out by myself now, which was one reason why, on a cold night in February, I turned up at the apartment of my friend Boaz Weinstein, who was hosting a gathering to talk about charity in a time of financial cataclysm.

Weinstein lives in a not-overly-luxurious-but-luxurious-enough building on Fifth Avenue. It is not the sort of building I could ever afford, but I tell myself I am not inclined to live on Fifth Avenue anyway; long-term exposure to liveried elevator operators would eventually bring me to Marxism. "Do you like this job?" I asked the operator in Weinstein’s building. He was a sagging man of 65 or 70; his eyes were rheumy and his nose spider-webbed with disintegrating capillaries.

"It’s a job," he said. He paused. "I’m retired." "But you’re working," I said. "Yeah. I’m working."

The coatrack in the hallway outside Weinstein’s apartment was crowded with sensible coats. The passed canapés inside were utilitarian, as passed canapés go. These were my kind of rich people, I thought, not the piggy kind, no John Thains or Stephen Schwarzmans in the bunch, certainly no Bernard Madoffs. (I met Madoff once. He wasn’t very nice. I think he judged me too poor to bother robbing.) We had gotten together at Weinstein's to talk about charity, but I was hoping to learn about my own economic future. These were people who were calculating 'present values' as 10-year-olds; people who had actual Swiss bank accounts; people who short Treasuries on their BlackBerrys; and one person, Weinstein himself, who won a Maserati in a poker tournament.

The writer Jonathan Rosen has described New York now as having a posthumous feel, but this was not entirely the case in Weinstein’s apartment, which was vibrating with superficial good cheer. Economic disintegration provokes in some people strange feelings of lightness. Of course, some of the people gathered there— say, those who spent the past year short-selling bank stocks— were experiencing the strange feeling of lightness that comes from acquiring huge, stinking piles of money.

But on the whole, anxiety lurked beneath the bonhomie. Within 10 minutes of my arrival, two friends separately and quietly suggested I buy gold, and right now. "You have to guard against the massive debasement of the dollar," one said. I explained to him my theory of market peaks— that the moment I buy a stock or a commodity is the moment it peaks. In any case, I would need substantially more of those soon-to-be-debased dollars to buy gold. But his arguments seemed sound.

Then another friend approached. "You don’t want to be long gold. The dollar is the currency of last resort for the entire world. There’s little chance of debasement." His argument also seemed sound. Everyone seemed to be in possession of sound arguments. Even people on CNBC sometimes seem to be in possession of sound arguments.

Weinstein stood up to make introductions. He was one of the early innovators in the field of credit-default swaps, and he earned billions of dollars for his former employer, Deutsche Bank— and tens of millions for himself— until last year, when his trades cost the bank $1.8 billion (though some of the bank’s positions rebounded by $600 million). I am in no position to judge what happened; Weinstein’s attempts to explain to me the workings of credit-default swaps have not borne the fruit of enlightenment.

Bill Ackman, the founder of Pershing Square Capital, was to lead the discussion. Ackman is tall, prematurely gray, and immoderately self-assured, the sort of winning figure who could be elected to the Senate one day, if the country ever decides to stop hating hedge-fund managers. Weinstein introduced Ackman as a perspicacious investor, which he is, generally.

Early in the current crisis, he suggested publicly that the decision of the bond-insurance company MBIA to guarantee billions of dollars of complicated mortgage investments would come to no good. But, like Weinstein, Ackman was not having the best year; one of his funds was betting solely on the resurgence of the Target corporation’s stock, and Target’s performance was not covering Ackman in glory. "I thought this was a perfect time to talk about philanthropy and investing, because they’ve merged; they’re both tax-deductible at this point," Ackman said, opening his talk.

He spoke mainly of the 'psychic' rewards of charitable giving, and of specific projects he supported. He asked for questions, which mainly concerned his prodigious charitable giving. Then someone asked a question about Ackman’s reputation:
"It used to be that in America, if you were a successful businessman, you were well-regarded. Now it seems that you are an evildoer if you’re successful, particularly in the financial world. Your profile is getting bigger. Do you think that’s good, or do people say, ‘He should be spending more time in the office and not so much out there’?"

Ackman responded:
"A lot of hedge-fund managers I know are incredibly charitable and also fundamentally great people. But the press— first of all, you don’t make that much money working for the press. Take The New York Times. The New York Times doesn’t make that much money, and the people who work there don’t make that much money. So you think about people who work for the press— generally, they resent people who have financial success. A combination of that, plus some bad actors in the business, is a negative. Why did I go on Charlie Rose? Why have I been a little more public? Part of that is to blunt some of the negative associations with our industry."

Hmmm. Yes, well.

It only seemed right for me to stick up for my fellow ink-stained proles, so I decided to make an intervention. But then I thought, This is Bill Ackman standing before me. He’s a great investor. Maybe he can give me some advice.

So this is what came out of my mouth:
"What do you tell the ordinary mortal— say, the person who works in the press that you talked about— what do you say to the person who has $20,000, $50,000, $100,000, or $200,000, maybe, parked somewhere doing nothing? What is your advice right now for that person?"

I looked around. The wizards in the room were having difficulty calculating figures of such humble size. I had thought $200,000 sounded like a large and unembarrassing number. But the room reacted as if I had asked, "Bill, I have 75 cents in my pocket. Do you think I should buy Twizzlers or a big red gumball?"

Ackman answered:
"First, it depends on when you’re going to need the money. I’ve always said that if you want to take risk— any risk— you have to be prepared to put your money away for five years or more. If it’s that kind of money, I would give someone a couple of alternatives. Do you have enough money in the bank that if you were to lose your job, you’ve got a good window to get reemployed? You’ve got to make sure you have a safety net.

"Buy a house. I think it’s a great time to buy a house. But put a
20 percent down payment, get a good mortgage from Fannie and Freddie … It’s one of the best investments you could make. The rest of the money, either invest in a very broad index fund— a Wilshire 5000 type of index fund— or if you want to do a bit of homework, I’d invest in a few great unlevered businesses that earn attractive returns. In my opinion, McDonald’s, Visa, maybe Berkshire Hathaway."

I think Ackman might not have been accustomed to talking to people like me, which would help explain why he sounded suspiciously like… a Merrill Lynch financial adviser.

He was, however, infinitely more compelling on the macro questions, and this was where the evening took a dark turn.
"One of the things that’s interesting about the last year is that you realize how much of our capital system is based on confidence— business confidence," he said. "If I’m confident I can refinance my debts when they come due, I’ll spend money. If I’m not confident I can refinance my debts when they come due, I’m not spending any more money. So if I can’t renew my home-equity loan and I’m not sure I can keep my job, I can’t spend. And you get into this death spiral."

I asked him,"What’s the chance we’re going into that death spiral?"

"We’re in it!" he said."Whether we’re going to die or not is another question."

"What’s the percentage chance we’re going to move to a barter economy?" I asked.

"I think it’s small," Ackman said.

"Small"? I had been hoping for "Zero." "Zero" would have been a fine answer, and not because I have nothing to barter except for a stack of old SmartMoney magazines, but "Zero" because, by the time my 12-year-old turns 18, I would like to be able to use my portfolio of stocks and bonds as a flotation device, and not as kindling.

"The way I see it, it’s all a con game," Cody Lundin was saying. "What I mean is that Wall Street has always been an illusion. Now it’s an illusion that’s crumbling. Wall Street is like someone who’s having heart trouble. It’s in constant need of resuscitation, but after a while, it just doesn’t work anymore. People think that Bernard Madoff was unique, that he was an illusion, but he’s just an extension of the same illusion, the same con game. This is one of the reasons I don’t like to have any debt. When you have debt, you become part of this illusion, and sometimes you get trapped by it."

We were standing outside in a foot of snow in the mountains above Prescott, Arizona. Lundin was arguing so cogently against the American culture of easy credit, in tones far more thoughtful than one hears on cable television, that I forgot for a moment that he wasn’t wearing shoes, or socks. He was standing in the snow barefoot. Also, in shorts.

"It’s all about regulating core body temperature." For long hikes in the snow, he wears three pairs of socks, without shoes. He suggested I try this.

Other things Lundin asked me to try include making fire with sticks, eating mice— "a free source of protein in survival scenarios"— and living without electricity for a week to "see where it hurts." Lundin himself eats mice and rats he traps at his off-the-grid passive-solar house in the wilderness, because "why waste free protein?"

Lundin is a freak; twin blond braids fall from his bandanna-covered head, giving him the appearance of a stoner Viking. But in the event that the economy crumbles, and civilization with it, I would appoint him my financial adviser. He is my favorite survivalist, the author of a book on getting by in the wilderness and another on urban preparedness, and a teacher of primitive-living skills. Survivalist, of course, has ugly political connotations.

A long time ago, I visited a place called Elohim City, on the Oklahoma-Arkansas border, that was home to a group of white supremacists. Their racism was repulsive, and their anti-Semitism wasn’t too pleasant, either. But I was impressed with one aspect of their lifestyle. On a tour, they showed me a vast storeroom filled with beans. Pinto beans, lima beans, all sorts of beans, vacuum-packed in garbage-can-size vats. Three years of food, for when the revolution comes. I knew, of course, that I didn’t need three years of beans in my house, but I took the lesson: it’s not the worst thing in the world to have a couple of weeks of food and water on hand, just in case a natural or man-made emergency is more than FEMA can handle.

Lundin is not a racist; in fact, he’s an Obama supporter, and he resents the racist associations attached to survivalism. Nor does he wish for the grid to go down. He says he enjoys electricity and indoor plumbing. He tends to think, though, that civilization is a thin film, and that in times of economic distress, it’s smart to be prepared for the day when Safeway runs out of milk. "This isn’t something I hope for. But what if the illusion does really crumble, and we have to move as a society to something else?"

I asked Cody how he invests his money. "I don’t believe in the intangible economy; I believe in the tangible economy. When I have extra money, I buy tools, food, or land. I like to be able to see what I’m buying. And I really don’t like debt, so I’d rather not have certain things than be in debt to anyone. I just feel better knowing that I don’t owe money, and I feel good knowing that I can take care of myself. That’s the American way, to be able to be self-reliant."

For the record, I don’t think the grid is buckling under the weight of consumer debt or the mistakes of AIG. But we’re in a strange moment in American history when a mouse-eating barefoot survivalist in the mountains of Arizona makes more sense than the chief investment strategist of Merrill Lynch.

"People need a plan, they need skills, and they need supplies. What would happen if the ATMs stopped working for a couple of days? People would panic. But you won’t panic if you’re prepared to ride out a disturbance."

Even out West, he says, people in the cities are unequipped to go for more than a day or two on their own. The Mormons, who are strongly encouraged by their church to keep a year’s supply of food in their homes, are an exception. "I know some people who say that if things go to hell, they’re just going to go to some Mormon’s house and steal all his shit. But that’s not right."

"Also, many Mormons keep guns."

"Yeah, there’s that."

The curious thing about listening to Cody Lundin is that in his ideas I heard echoes of ideas I’ve been hearing from people very much dependent on the financial grid. Bill Gross, the founder of Pimco, the world’s leading bond trader (and, according to a September 2008 ranking by Forbes, America’s 227th-richest person), suggested that thrift— not mouse-eating thrift, but more moderate forms of thrift— is quickly becoming the norm, as a result of society’s massive over-leveraging.

"Risk-taking went over the edge," he told me. "We are inventing something new. We’re very afraid. We know from the Depression that people who lived through it didn’t change their mentality for the rest of their lives. They were sewing their socks. They refused to take a lot of chances. My sense is that it will take 10 or 20 years to find that spark of risk-taking in people again."

When I told Seth Klarman, one of the country’s leading value investors, about my visit with Cody Lundin, he said, "It’s always smart to prepare for disaster. In investing, that means holding disaster insurance. In your personal life, it makes sense to have inexpensive disaster protection, so come what may, you’re ready for any eventuality. I like to store some extra bottled water in the basement, but my wife thinks it’s too much clutter. I told her I’d share my water with her anyway."

While I’d choose Cody Lundin to serve as my off-the-grid adviser, I would choose Seth Klarman as my on-the-grid adviser, if only he were taking clients.

Klarman was hired out of Harvard Business School to manage a $27 million fund that, as of early this year, had grown to $14 billion. He is also the author of one of the more expensive books in the world, Margin of Safety. An out-of-print guide to value investing, it sells for as much as $2,500 per copy on the Web.

Klarman is an acolyte of Ben Graham, the original value investor. Value investors— Warren Buffett is the most famous— seek out distressed, underappreciated assets, buy them, and wait until the rest of the world realizes that they’re worth something. [[But, unless you're buying increasing earnings along with the depressed assets, that can be a long wait!: normxxx]]

"The overwhelming majority of people are comfortable with consensus, but successful investors tend to have a contrarian bent," Klarman said over lunch one day in an empty Boston restaurant. "Successful investors like stocks better when they’re going down. When you go to a department store or a supermarket, you like to buy merchandise on sale, but it doesn’t work that way in the stock market. In the stock market, people panic when stocks are going down, so they like them less when they should like them more. When prices go down, you shouldn’t panic, but it’s hard to control your emotions when you’re overextended, when you see your net worth drop in half and you worry that you won’t have enough money to pay for your kids’ college."

One theme of Margin of Safety [[(it's a bargain on Amazon for $678.88): normxxx]] is that people like me aren’t equipped to be investors. "No one knows what he’s doing unless he’s a full-time professional," he said. "As in many professions, full-time experts have an enormous advantage. Investing is highly sophisticated and nuanced. The average person would have an incredibly hard time competing."

I asked Klarman if he wasn’t working against his own financial interest by arguing that average people aren’t qualified to be investors.

"Most people on Wall Street do well enough," he said. "It’s regrettable that anyone would want a client to take risks beyond what the client could handle."

He agreed with Robert Soros that the financial-services industry treats the small investor not as a client but as a source of ready cash. "The average person can’t really trust anybody. They can’t trust a broker, because the broker is interested in churning commissions. They can’t trust a mutual fund, because the mutual fund is interested in gathering a lot of assets and keeping them. And now it’s even worse because even the most sophisticated people have no idea what’s going on."

After 15 years of pabulum, I was enjoying, in a perverse sort of way, receiving straight talk from masters of finance.

"Everybody these days is a just-in-time investor. People say, ‘I’m going to leave my money in the market as long as possible, and then pull it out of the market just before I have to write the tuition check.’ But I think we’re seeing that the day you need to pull it out of the market, the market might be down 50 percent. It’s critical not to be greedy. Avoid leverage and don’t invest money that you can’t stand to lose."

"I haven’t leveraged myself," I said.

He asked me if I had a mortgage. Yes. He then asked me if the amount of money I had invested in the stock market was greater than the amount I owed on my mortgage— could I liquidate what remained of my portfolio to pay off my mortgage? I could.

"So you are leveraged. Why are you keeping your money in the market?"

"Because— "

"It’s because you think you’re going to make more money in the market than you’re paying in interest on your mortgage."

"Yup."

"Well, are you?"

"Uhh, no. But I’m getting the mortgage-interest deduction."

"Yes, the interest is deductible. But if you had capital gains in the market, you’d pay taxes on those. In the aftermath of this financial crisis, I think everyone needs to look deep within themselves and ask how they want to live their lives. Do they want to live close to the edge, or do they want stability? In my view, people should have a year or two of living expenses in cash if possible, and they shouldn’t use leverage anywhere in their lives."

"But if I dump my portfolio now, I make my losses real."

"How are you going to feel if the market drops another 50 percent?"

Klarman went on, "Here’s how to know if you have the makeup to be an investor. How would you handle the following situation? Let’s say you own a Procter & Gamble in your portfolio and the stock price goes down by half. Do you like it better? If it falls in half, do you reinvest dividends? Do you take cash out of savings to buy more? If you have the confidence to do that, then you’re an investor. If you don’t, you’re not an investor, you’re a speculator, and you shouldn’t be in the stock market in the first place."

Several years ago, I went to a party at a hedge-fund manager’s loft in Lower Manhattan. The elevator opened directly into the loft, which was as big as Mussolini’s office. An Austin Powers bed was parked to one side. I left the party with a friend of mine, David Segal, who is now a business reporter at The New York Times. As we walked to the subway, he said, "You know, we should get one of those hedge funds."

"Absolutely," I said. "Where do we get one?" "I don’t know. Maybe we can find one on the Street. But we need one." "Yes, we do."

When I think back on that conversation, I realize that it represents for me the apex of hedge-fund mania. Which is to say, when two reporters realize they should get into the hedge-fund business, it might be somewhat late to get into the hedge-fund business.

Seth Klarman is right. I’m not an investor. Very few people in America actually are. I never had the knowledge or the time to master the stock market. I thought I knew how to manage the danger, which is why I invested to a disproportionate degree in the Dow 30. I’ve learned, however, that it’s quite possible to ride the Dow 30 a far way along the risk curve.

And I’ve learned another thing: I once believed that a buy-and-hold strategy would make me rich. This was a mistaken belief. "The economy comes in cycles," Robert Soros said. "If you believe that the economy is not cyclical, then buy-and-hold is for you." He taught me a Wall Street expression: "An investment is a trade gone bad."

Though the past six months of my financial life have been marked mainly by paralysis, I have, in fact, made a couple of decisions. I’ve decided to deplete the world’s supply of gold by two ounces. (Attention all Atlantic-reading burglars: it’s not in my house.) You’ll be pleased to know that the price of gold fell $70 the week after I bought.

And my wife and I have decided to fire our Merrill Lynch financial adviser. We’re not firing him because we realized that his company couldn’t manage its own money, much less ours, and we’re not firing him for his bad advice. I was the one, after all, who pulled the trigger on the purchase of 100 shares of AIG. (It would have been good of him to have warned us about what was coming, but that would have necessitated him knowing what was coming.)

We’re also not firing him because his research chief wants us to elongate our already too-long time horizon. And we’re not firing him because John Thain, his former CEO, spent the fees we paid his company on a $35,000 commode. We’re firing him mainly because he fired us. He never said he was firing us. He just stopped calling. Eventually, I stopped calling him. I got the message.

Our main job now is finding someone to advise us. This is a very difficult task.

I asked Bill Gross what he thought I should do. He was somewhat dyspeptic. "The system is rigged," he said. "It’s difficult for the average investor to even conceptualize what we’re talking about. For this reason, I think financial advisers are still worthwhile, but the average investor can no longer pay them what they felt they were worth. You should find someone who isn’t overpromising or overcharging."

This search is made more difficult because we don’t have enough money to make ourselves interesting to most of the best advisers [[a bare bones minimum of $10 million$100 million plus preferred: normxxx]], and the typical adviser is not sufficiently independent-minded to be effective.

"There’s enormous pressure to provide conventional advice," Klarman explained, "and tremendous pressure against providing unconventional advice. Advisers only recommend what’s conventionally palatable. They tend to say 60 percent stocks, 40 percent bonds, and they’re not likely to move away from that, no matter how extreme valuations are. They’re not likely to move away from it when the market is really high, or really low. A big part of the problem is that there isn’t a perfect answer to any of this. No one can tell you how to allocate your assets 100 percent of the time. The average investor is not getting Warren Buffett to look at his portfolio; he’s getting a printout from a computer model."

Unconventionality makes me nervous, but less so than conformity. I’m finished with conformity. In picking an adviser, I’m also looking for someone who is unleveraged; someone who is putting his own money into the investments he’s recommending; and someone who can explain to me in a few sentences, in language easily understood by earthlings, his philosophy of investing.

Despite everything, I’m not overly pessimistic. I’m long on America, as my friends on Wall Street might say. I believe that equities will grow in value. I expect the Dow to return to 9,000, or 10,000, if not sooner, then later. And when it does, if I’m not already out, I might just get out. [[So that, if enough investors are thinking that way, good-bye to another run at 15,000, at least for this generation.: normxxx]] I’m not enjoying this particular ride.

I no longer expect to get rich. It makes me happy to realize this. It also makes it easier to give more money to charity. In retrospect, I can’t imagine what led all of us to believe that we could regularly expect double-digit annual returns on our money, for doing no work. Maybe this attitude will cause me to miss the next great run-up.

No matter. I’ll take 3 or 4 percent gains a year, or 1 or 2, if necessary. I’ll keep more cash on hand. I’ll keep a two-week supply of meals-ready-to-eat, bottled water, and lanterns in my basement. If things get bad, I’ll take my family and drive west, to find Cody Lundin. And if the bottom truly falls out, I’ll find a Mormon and ask him, politely, if he’ll share.

Jeffrey Goldberg tells Bob Cohn why he bought gold, stocked up on lanterns, consulted a survivalist— and finally fired his broker.

ß§

Normxxx    
______________

The contents of any third-party letters/reports above do not necessarily reflect the opinions or viewpoint of normxxx. They are provided for informational/educational purposes only.

The content of any message or post by normxxx anywhere on this site is not to be construed as constituting market or investment advice. Such is intended for educational purposes only. Individuals should always consult with their own advisors for specific investment advice.

Wednesday, April 15, 2009

The Incredibly Shrinking Market Liquidity

The Incredibly Shrinking Market Liquidity, Or The Upcoming 'Black Swan' Of "Black Swans"
Click here for a link to ORIGINAL article:

[ Normxxx Here:  Apparently, Wall Street is trading mainly with itself (so, what else is new?), supplying most of the volume and the upward bias— this article is expecting an imminent repeat of August, 2007!

Obviously, if true, this could be a highly significant warning of what's to come by late Spring/Early Summer, but unfortunately I cannot vouch for the accuracy or perspicacity of the author or his sources. You'll have to judge for yourself. (But it sounds only too true to me!)
 ]


By Tyler Durden | 16 April 2009

"Anyone who is doing anything sensible right now is either losing money or is out of the market entirely." These are the words of a 'quant' trader, who is seeing something scary in the capital markets. Scary enough to merit a warning that we could be on the verge of another October 87, August 2007, or January 2008.

Let's back up. I recently posted a chart which tracks equity market neutral strategies: in essence a cross section of quant funds for which there is public performance tracking. The chart is presented below.


Click Here, or on the image, to see a larger, undistorted image.


There is not much publicly available data to follow what goes on in the mystery shrouded 'quant' world. However, another chart that tracks the market neutral performance is the HSKAX, or the Highbridge Statistical Market Neutral Fund, presented below. As one can see we have crossed into major statistically deviant territory, likely approaching a level that is 6 standard deviations away from the recent norms.


Click Here, or on the image, to see a larger, undistorted image.


What do these charts tell us? In essence, that there is a high likelihood of substantial market dislocations based on previous comparable situations. More on this in a second.

Why quant funds? Or rather, what is so special about quant funds? The proper way to approach the question is to think of the market as an ecosystem of liquidity providers, who, based on the frequency of their trades, generate a cushioning to the open market trading mechanism. It is a fact that the vast majority of transactions in the market are not customer driven buy/sell orders, but are in fact high frequency, small block trades that constantly cross between a select few of these same quant funds and program traders.

This is a market in which the big players are Renaissance Technologies Medallion, Goldman Sachs and GETCO. Whereas the first two are household names, the last is an entity known primarily to quant market participants. Curiously, the Philosophy section in GETCO's website exactly captures the critical role that quant funds play in an "efficient" market.

What’s good for the market is good for GETCO

"GETCO’s strategy is to align our business plan with what is best for the marketplace. We earn our revenues by providing enhanced liquidity and efficiency to electronic financial markets, which in turn results in lower costs for market participants (e.g. mutual funds, pension funds, and individual investors).

"In addition to actively trading, we partner with many exchanges and their regulators to increase transparency throughout the industry and to create more efficient means for the transference of financial risk."

A good example to visualize the dynamic of this liquidity "ecosystem" is presented below.


In order to maintain market efficiency, the ecosystem has to be balanced: liquidity disruptions at any one level could and will lead to unexpected market aberrations, such as exorbitant bid/ask margins, inability to unwind large block positions, and last but not least, explosive volatility: in essence a recreation of the market conditions approximating the days of August 2007, the days post the Lehman collapse, the first November market low, the irrational exuberance of the post New Year rally, and the 666 market lows.

The above tracking charts indicate that something is very off with the "slow", "moderate" and "fast" liquidity providers, indicating that liquidity deleveraging is approaching (if it is not already at) critical levels, as the vast majority of quants are either sitting on the sidelines, or are merely playing hot potato with each other (more on this also in a second). What this means is that marginal market participants, such as mutual and pension funds, and retail investors who are really just beneficiaries of the liquidity efficiency provided them by the higher-ups in the liquidity chain, are about to get a very rude awakening.

Also, it needs to be pointed out that the very top tier of the ecosystem is shrouded in secrecy: conclusions about its state can only be inferred based on observable metrics from the HSKAX and HFRXEMN. It is safe to say that any conclusion drawn based upon observing these two indices are likely not too far off the mark. Skeptics at this point will claim that it is impossible that quant and program trading has such as vast share of trading. The facts, however, indicate that not only is program trading a material component of daily volumes, it is in fact growing at an alarming pace. The following most recent weekly data from the New York Stock Exchange puts things into perspective:


Click Here, or on the image, to see a larger, undistorted image.


According to the NYSE, last week program trading was 8% higher than the 52 week average, which on almost 4 billion shares is a material increase. It is probably safe to say that the 1 billion in program trades last week does not account for significant additional low= to high-frequency trades originated at non-NYSE members, implying the real number for the overall market is likely even higher. Some more program trading statistics: principal trading is running 21% above 52 week average, agency trading is 11% below average, while NYSE weekly volume is running about 9% below 52 week average.

A very interesting data point, also provided by the NYSE, implicates none other than administration darling Goldman Sachs in yet another potentially troubling development. The chart below demonstrates the program trading broken down by the top 15 most active NYSE member firms. I bring your attention to the total, principal, customer facilitation and agency columns.


Click Here, or on the image, to see a larger, undistorted image.


Key to note here is that Goldman's program trading principal to agency+customer facilitation ratio is a staggering 5x, which is multiples higher than both the second most active program trader and the average ratio of the NYSE, both at or below 1x. The implication is that Goldman Sachs, due to its preeminent position not only as one of the world's largest broker/dealers (pardon, Bank Holding Companies), but also as being on the top of the high-frequency trading/liquidity provision "food chain", trades much more often for its own (principal) benefit, likely in tandem with the other top dogs on the list: RenTec, Highbridge (JP Morgan), and GETCO.

In this light, the program trading spike over the past week could be perceived as much more sinister. For conspiracy lovers, long searching for any circumstantial evidence to catch the mysterious "plunge protection team" in action, you should look no further than this. Following on the circumstantial evidence track, as Zero Hedge pointed out previously, over the past month, the Volume Weighted Average Price (VWAP) of the SPY index indicates that the bulk of the upswing has been done through low volume buying on the margin and from overnight gaps in afterhours market trading.

The VWAP of the SPY through yesterday indicated that the real price of the S&P 500 would be roughly 60 points lower, or about 782, if the low volume marginal transactions had been netted out. And yet the market keeps on rising. This is an additional data point demonstrating that the equity market has reached a point where the transactions on the margin are all that matter as the core volume/liquidity providers slowly disappear one by one through ongoing deleveraging.

Unfortunately for them, this is not a sustainable condition.

As more and more quants focus on trading exclusively with themselves, and the slow and 'vanilla' money piggy backs to low-vol market swings, the aberrations become self-fulfilling. What retail investors fail to recognize is that the quants close out a majority of their ultra-short term positions at the end of each trading day, meaning that the 'vanilla' money is stuck as a hot potato bagholder to what can only be classified as an unprecedented ponzi scheme. As the overall market volume is substantially lower now than it has been in the recent past, this strategy has in fact been working and will likely continue to do so… until it fails and we witness a repeat of the August 2007 quant failure events… at which point the market, just like Madoff, will become the emperor revealing its utter lack of clothing.

So what happens in a world where the very core of the capital markets system is gradually deleveraging to a point where maintaining a liquid and orderly market becomes impossible? Large swings on low volume, massive bid-offer spreads, huge trading costs, inability to clear and numerous failed trades. When the quant deleveraging finally catches up with the market, the consequences will likely be unprecedented, with dramatic dislocations leading the market both higher and lower on record volatility. Furthermore, high convexity names such as double and triple negative ETFs, which are massively disbalanced with regard to underlying values after recent trading patterns, will see shifts which will make the November SRS jump to $250 seem like child's play.

For readers curious about just how relevant liquidity is in the current market, I recommend another recent post that discusses DE Shaw's opinion on the infamous 'basis' trade, in which their conclusion was that establishing a basis trade, which is effectively the equivalent of selling a put option on market liquidity, ended up in massive financial carnage as the market rolled from one side of the trade to another. Is it possible that what the basis trade was for credit markets (most notably Citadel, Merrill and Boaz Weinstein), so the quant unwind will be to equity markets?

So when will all this occur? The quant trader I spoke to would not commit himself to any specific time frame but noted that a date as early as [last] Monday could be a veritable D-day. His advice on a list of possible harbingers: continued deleveraging in quant funds as per the charts noted above, significant pre-market volatility swings as quants rebalance their end of day positions, increasing principal program trading by Goldman Sachs on decreasing relative overall trading volumes, ongoing index VWAP dislocations.

One thing is for certain: the longer the divergence between real volume trading/liquidity and absolute market changes persists, the more memorable the ensuing market liquidity event will be. At the end of the day, despite the pronouncements by the administration and more and more 'sell-side' analysts that the market is merely chasing the rebound in fundamentals in what has all of a sudden become a V-shaped recovery, the "rally" could simply be explained by technical capital-liquidity aberrations, which will continue at most for mere weeks if not days. [[Or, even by Seasonal Timing effects; but, either way, it looks like a 'jolly' summer will be had by some.: normxxx]]


  M O R E. . .


Normxxx    
______________

The contents of any third-party letters/reports above do not necessarily reflect the opinions or viewpoint of normxxx. They are provided for informational/educational purposes only.

The content of any message or post by normxxx anywhere on this site is not to be construed as constituting market or investment advice. Such is intended for educational purposes only. Individuals should always consult with their own advisors for specific investment advice.

The End Of The FIRE Economy

The End Of The FIRE* Economy

*Financial, Insurance, and Real Estate.

Here Comes Another Set Of Dodgy U.S. Bank Loans
The Next Big Financial Meltdown: Insurance!?!

By John Browne | 2009

Several weeks ago Citigroup shocked Wall Street by announcing that the company would be profitable in the current quarter. And, since the FASB has now allowed banks to 'refrain' from having to mark their assets to market, many more banks have reported the same. At the same time, the Obama Administration indicated that it would be unlikely to nationalize American banks, preferring to provide low cost funding to encourage the private sector to buy distressed assets from the banks. The two developments has sparked a vigorous rally in financial stocks, which previously had been drifting downward for weeks, caught in what appeared to be an unending death spiral. But have the good times really returned?

On the surface at least, there are some promising points. Based on current income, and an upward trending yield curve (that will allow banks to borrow at nearly no cost from the Fed and lend to borrowers at a good profit) the banks should generate strong cash flow. But that is hardly the full story.

Continued gradual write-downs in the value of toxic assets already held on bank's balance sheets will explode like miniature time bombs, rendering banks a poor source of earnings for years to come. For many of our largest banks, these debts are probably too large to be overcome by a positive cash flow fueled by cheap access to short-term funding— at least within a single year. Hence, these banks are 'technically' insolvent from a capital balance sheet point of view. This is the underlying problem that America and much of the world face with their banks: banks can be trading with positive cash flow but from a technically insolvent capital position— which is illegal. [[And the International Accounting Standards Board (IASB) has so noted, with a scathing disapproval of the FASB action.: normxxx]]

Some argue that toxic assets make up only a very small part of the total assets of the banking system. That may be so, but the real issue is the enormous size of the toxic assets in relation to both the capital of the banks and the funding ability of the government. According to the Bank of International Settlements, the world's total of derivatives investments, including the poorly understood credit default swap (CDS) market reached some $700 trillion at its height, or more than 20 times the world's total annual production! The American portion was about $419 trillion, or some 40 times America's annual production.

The essential problem is that these inherently risky securities were used as collateral for loans. The fall in their value resulted in massive deleveraging. Of course, not all derivatives are yet flawed, or toxic. So, it can be assumed that, in the absence of a total financial collapse, only a limited number will default.

However, if a conservative assumption were made that only some two percent of derivatives fail, it would still amount to some $14 trillion. The American share would be about $8 trillion, or almost one year of GDP once that figure declines to a sustainable level. The estimated total capitalization of all U.S. banks is some $1.6 trillion. But, this amounts to only 20 percent of the potential American liability.

So far, American citizens have been forced to provide financial institutions with nearly $2-3 trillion in additional bailouts. This brings the total of current U.S. banking capital to some $3.6 trillion, still less than half of the potential problem, leaving a massive $4.4 trillion shortfall. In light of this, even noted bearish economist Nouriel Roubini's estimate of a $3.6 trillion shortfall appears to be too optimistic.

Of course, not all American banks are in trouble. There are a number of local and regional banks whose managements did not participate in gambling away America's financial future. [[But see the next article below!: normxxx]] Nevertheless, investors should ask themselves some hard questions. What if the government is forced to face the fact that the U.S. banking system, as a whole, is already fundamentally insolvent? What if the Administration is therefore forced, despite its expressed disinclination, to nationalize the problem banks?

Most importantly, after the 'good' banks have been separated from the 'bad' in the FDIC's 'corral,' what will happen to those 'bad' banks? Worse still, what will happen to all of those 'bad' international banks— especially those European banks which cannot avail themselves of the accounting relief permitted by FASB? What will happen to consumer confidence and the price of gold?

Citigroup says that it is profitable. At the same time, most banks are in dire straits. Until Citigroup is able to put its capital where its mouth is, investors in U.S. financials should remain very, very cautious. [[But it looks like its delaying tactics in marking down its assets really has paid off for Goldman Sachs. Do you think they had any advance notice of what FASB was planning?: normxxx]]

ß§

.

Here Comes Another Set Of Dodgy U.S. Bank Loans!

By James Saft | 2009

LONDON (Reuters)— Banks in the U.S. face a new source of write-downs and failures this year and next as loans made to developers to finance residential and commercial property development rapidly go bad. And as these loans are old-fashioned and concentrated in smaller banks, their fate is particularly interesting as it indicates that issues with the banking system go far deeper than the so-called "toxic assets" belonging to the largest lenders that have thus far gotten most of the attention and government aid.

They are also a great illustration of the difficulties of stopping a housing and deleveraging crash. Called Acquisition, Construction and Development (ADC) loans, they total 8.4 percent of all bank loans, just below a 30 year peak, and are used by developers to buy land, put in infrastructure, and construct housing or commercial and office space. And because they are dependent on a reasonably healthy real estate market— someone who is willing to buy or rent the properties— when projects are completed, they are now in deep trouble.

"Everyone in the media is focused on consumer foreclosures. What they're not focused on is the builder developer foreclosures which are only in the early innings and which will continue to wreak havoc as these assets are liquidated at depressed prices. Until they are cleared there can't be a stabilization in home prices," said Ivy Zelman, a longtime housing analyst at Zelman & Associates, who thinks the pressure will cause "hundreds of banks" to be closed and liquidated.

"The Federal Deposit Insurance Corporation doesn't have the funds to deal with all this. They don't have the scalability to deal with all these problem banks. They can't examine the smaller banks fast enough," she said.

Zelman estimates that U.S. banks risk having to charge off an additional $84 billion of ADC loans between now and 2013, equal to a hit of nine percent of Tier 1 capital. That is damage banks can ill afford just about now, given the rising trend in delinquencies on consumer and home purchase loans, not to mention a deteriorating outlook for general commercial loans.

Non-performing ADC loans hit 8.5 percent at the end of the year, up from just 3.2 percent the year before. Loans delinquent between 30-89 days are also up, by 25 percent in the quarter to 2.9 percent. And developers, struggling to try to survive without reliable cash flow from sales, are drawing down on commitments from banks that are not secured. The percentage of unsecured construction loans drawn down hit 73 percent, already above the peak seen during the 1990s real estate slump and a crucial sign of builder distress.

FDIC Funding Crunch

Of particular concern is the way in which ADC loans are concentrated in smaller and community banks, which tend to have long and deep relationships with local developers. ADC loans account for 47 percent of non-performing loans at small banks as against 14 percent at larger banks.

And you can't blame mark-to-market or toxic securitizations for these losses. They are considered held-to-maturity and are not typically included in any complex securities. Chris Whalen of Institutional Risk Analytics, which specializes in bank risk analysis, sees ADC loans as part of the difficulties banks face with commercial real estate, and believes that regulators will be forced to get tough with banks in forcing them to write down exposure to struggling firms and deals.

"It will be subject to an impairment test and then they will have to start charging it off. The regulators are already beginning to force the community banks," he said. And while smaller banks being closed by the FDIC may not get the attention of a bailout of a big bank like Citigroup, every failure depletes resources and hurts credit availability.

The FDIC fund fell by almost half in the fourth quarter alone, touching $18.9 billion as it set aside a large portion of money for actual and expected bank failures. The FDIC has said it needs a bigger cushion but moves to impose special fees on healthy banks will inevitably hit profitability and credit availability. Democratic Senator Christopher Dodd, chairman of the Senate Banking Committee, is moving to introduce legislation that would more than triple— to $100 billion— the FDIC's line of credit with the Treasury Department.

But even beyond bank failures, ADC loan woes point to the intractable problems of a real estate bust. Banks, while trying to reduce their overall exposure to these loans, have been reluctant to pull the rugs from under borrowers because, as with a house foreclosure, they end up owning a hard-to-sell underlying asset. But more foreclosures are coming, and with them fire sales as banks compete with those developers who still are in business, and with homeowners, and with home foreclosure sales to liquidate inventory.

That will drive land and real estate prices down further and suck others into what amounts to a negative self-reinforcing cycle. That's true for housing, true for banking, and true for the economy.

ß§

.

The Next Big Financial Meltdown: Insurance!?!

By Michael Brush, MSN Money | 2009

The mortgage and credit sickness that brought banks and brokers to their knees has now infected the companies that insure our lives and protect our families. The life insurance companies that millions of Americans entrust to help protect their families or pay the bills in their golden years are caught in a downward spiral eerily similar to the one that has brought down banks and brokers. Like Bear Stearns and Lehman Bros., life insurers Hartford Financial Services (HIG), Principal Financial Group (PFG), Lincoln National (LNC) and many others all have significant exposure to mortgage-backed securities and other risky debt instruments.

They're reporting huge losses that— if they continued— could trigger a meltdown.

That could wipe out shareholders, who already have suffered declines of 20% to 50% since the meltdown began. Customers with annuities or insurance policies might have to turn to state insurance backstop funds and settle for only a portion of the money they were expecting. Health, auto and property insurers are better off. But based on how far life insurance stocks have fallen, investors are worried many won't survive at all.

What are the chances this doomsday scenario will play out?

"To know that, you have to gauge how bad this market will get over the next six months, which none of us know," responds Jim Ryan, an analyst with Morningstar (MORN). It all comes down to how much worse things could get for the economy and for the debt instruments and stocks that life insurance companies hold. "We're telling people to be more careful, particularly if you are going into longer-range products that involve significant upfront funding like annuities," says Bob Hunter, the director of insurance for the Consumer Federation of America. "You want to make sure that the company is actually around when you want to get the money out. I'd say there's a good likelihood some of them will go under."

Death Spiral

It's easy to imagine a spiral that takes many insurers out or at least has them begging for help from the federal government. It starts with those serious market losses. Life insurance companies rely on investments in bonds and stocks to meet cash-flow needs years from now. But because of exposure to dubious debt securities backed by shaky subprime and commercial real-estate loans, they're now piling up investment losses big time.

In early February, for example, Hartford Financial reported a loss of $806 million, or $2.71 per share for the previous quarter, including a $610 million realized loss on investments. Lincoln National reported a $1.98-per-share loss, including a realized loss on investments of $238 million after taxes. This isn't the end of it. Analysts at Morgan Stanley (MS), for example, estimate Lincoln National is sitting on $7.6 billion more in unrealized losses in its $58 billion investment portfolio. Many other companies have significant unrealized losses, too.

These big losses create two problems for life insurance companies. First, they have to reserve more capital against payments they promise by selling annuities and life insurance policies. More importantly, the erosion of their capital bases has ratings agencies downgrading their debt. If that continues, big corporate customers and individuals might consider them too risky and pull business— sparking a "run on the bank" at insurers.

"Over the course of 2009, we expect signs of a flight to quality on the part of annuity buyers," Wachovia analyst John Hall wrote in a recent research note. He thinks that's already playing out at Lincoln National. All of this, then, brings another cycle of downgrades in credit ratings— a kind of vote on how likely a company is to pay back its debt. Taken to extremes, investment losses that spark ratings downgrades— combined with stock price declines— would make it virtually impossible for insurers to raise capital. It would also be tough to roll over debt coming due over the next two years.

Poof. There would go your life insurance companies.

This scenario inched closer to reality in recent weeks as insurers announced big fourth-quarter losses. The news had debt-rating agencies such as Fitch Ratings, Moody's Investors Service and Standard & Poor's Ratings Services cutting their ratings for Hartford, Principal Financial, Prudential Financial (PRU) and Genworth Financial (GNW), citing "surging investment losses and weakening earnings capacity."

Some Help From Regulators

As a sign that the problems for insurers are getting more serious, regulators are loosening accounting standards to try to help them out. In the past few weeks, insurance regulators in Connecticut, Iowa and Ohio have eased accounting standards for life insurers like Hartford and Allstate (ALL) in an effort to help them meet standards for capital on hand.

State regulators are allowing insurers to count future tax refunds as capital on hand. They are also permitting insurers to reserve less cash against promised annuity payments. Again, this seems disconcerting, since you might expect regulators to ask for more reserves at a time when investment assets are falling.

"They are trying to grasp for other forms of capital," says Donald Thomas, an accounting analyst with Gradient Analytics. "This is a sign of stress among these companies." The Consumer Federation of America likens the practice to doling out "lollipops at a barbershop."

Don't Worry, Be Happy

Though industry supporters acknowledge there could be serious trouble if the economy and the markets sink low enough, they cite several reasons a doomsday scenario isn't realistic:

First, life insurers typically have very little money invested in stocks or risky mortgage-backed securities. Most of it is in bonds— and in a broadly diversified portfolio of high-grade corporate or government bonds at that, maintains Steven Weisbart, the chief economist at the Insurance Information Institute. "There may be one portion of their portfolios where they are experiencing investment losses, but you have to look at their overall business and how they are managing that business," Ohio Insurance Director Mary Jo Hudson told me. "Based on the analysis that we do here in Ohio, the insurance companies are safe and sound."

Next, outright bankruptcies are unlikely, says Sterne Agee analyst John Nadel, because life insurance companies have agreed to make payouts over the long term— typically several decades from now. They can survive near-term market weakness because they aren't required to make paybacks right away. Nadel also doubts a run on the insurance companies will occur, because they charge hefty fees for cashing out accounts. Uncle Sam hits policyholders with penalties for cashing out early, too.

And, unlike Bear Stearns and Lehman Bros., insurers did not borrow huge amounts of money to make investments, Connecticut Insurance Commissioner Thomas Sullivan says. Despite recent downgrades to its debt rating, Principal Financial says its capital position actually doubled in the fourth quarter to about $800 million and that it still has relatively strong debt ratings and a strong capital base. The company also says it won't have to pay out on many of its annuities and policies for a long time, so it can wait out near-term unrealized losses on investments. It also says that its wealth management divisions could continue to operate well even if the company got lower ratings.

Last Friday, Hartford chief Ramani Ayer told investors: "We entered 2009 well-capitalized and with ample liquidity. The Hartford remains well-prepared to meet our commitments to our customers, as we have for the past 200 years." And as for relaxed accounting rules, two state insurance commissioners I spoke with defended the practice.

Allowing insurers to take credit for deferred tax assets makes sense because insurance companies typically overpay taxes on life insurance premiums. The taxes get paid back to the companies over time, says Hudson, Ohio's chief insurance regulator. So allowing companies to recognize 15% of the deferred tax asset— up from 10%— is no big deal.

Next, insurers already reserve more than required for variable annuities. An easing of the standards has been approved by the National Association of Insurance Commissioners for 2010. Regulators are only speeding up that change, Connecticut's Sullivan says.

It's also important to keep in mind that health, auto and property insurance companies make fewer long-term investments, because their policies and payouts stretch out over much shorter periods. They invest in more-liquid short-term securities and may not face the same level of portfolio losses as life insurers. As for those life insurers, the points above may be reasons to feel more secure. But if the economy and the markets continue to tumble hard, the companies won't be safe.

The number of companies with quality debt that is on the verge of slipping into junk territory hit an 18-year high in January, according to Standard & Poor's. That's the supposedly safe debt the insurers are invested in. Nouriel Roubini of RGE Monitor thinks continuing economic damage will ultimately push their credit losses to $3.6 trillion, up from recent levels of around $1.6 trillion.

(You can check S&P ratings of insurers at Insure.com and ratings from A.M. Best here. Keep in mind, the ratings may not reflect the latest gyrations of the market.)

Government Guarantees

If your insurance company does go bust, you'll get a hand from "guarantee funds" run by states. Once the assets of a bankrupt insurer were exhausted, policyholders could file claims against these state funds for insurance losses or lost annuities. One drawback is that these funds limit claims to a few hundred thousand dollars. "If you have a million-dollar life insurance policy, you're going to get a haircut," says Hunter, of the Consumer Federation of America.

And a lot of these state guarantee funds don't actually have any money. Instead, they assess surviving insurance companies for the money they need to satisfy claims. In a real disaster scenario that took out a lot of insurance companies, it might be hard for states to raise enough money to satisfy claims. At that point, some states would dip into their general funds[!?!]

Ultimately— in the meltdown scenario— it might be Uncle Sam that would be asked, once again, to save the day. Last month, federal banking regulators approved applications from Hartford and Lincoln National to acquire existing savings and loans and become 'thrift' holding companies. That move makes an insurer eligible for federal government bailout funds.

Voilà. Problem solved— assuming taxpayers will stomach more bailouts at that point. [[But, since there is no sign that taxpayers are now or ever will have to fund any of this, who cares!?!: normxxx]]

ß§

Normxxx    
______________

The contents of any third-party letters/reports above do not necessarily reflect the opinions or viewpoint of normxxx. They are provided for informational/educational purposes only.

The content of any message or post by normxxx anywhere on this site is not to be construed as constituting market or investment advice. Such is intended for educational purposes only. Individuals should always consult with their own advisors for specific investment advice.

Tuesday, April 14, 2009

Is That Recovery We See?

Is That Recovery We See?

By John Mauldin | 10 April 2009

Is That Recovery We See?
Those Wild and Crazy Analysts
The Shadow Inventory of Homes
Commercial Real Estate Starts a Long, Slow Slide
P/E Ratios Go Negative!
The Effect of Earnings Surprises
Corporate Earnings and Recovery in Recessions
The Implosion in Social Security

The market, we keep hearing and reading, is telling us that there is recovery around the corner. And pundits point to data that seems to suggest the worst is behind us. The leading economic indicators, while still down significantly, seem to be in the process of bottoming. There is a large amount of stimulus in the pipeline. Mark-to-market has been modified. Housing seems to be finding a bottom, if you look at the rise in sales from January. And so on.

In this week's letter, we look at what past recoveries have looked like in terms of corporate earnings; and we look at the continued slide in earnings on the S&P 500, which has a negative price-to-earnings ratio looming in future months (yes, that is not a typo, we have an unprecedented earnings multiple). We take a peek at housing and foreclosures. There is just so much bad news out there (like continued [[and rising?: normxxx]] unemployment) that it just has to get better, doesn't it? This should make for an interesting letter.

Is That Recovery We See?

This week the market seemed to like financial stocks and was buoyed on news that Pulte Homes would buy Centex to create the largest US homebuilder. And with banks having some room to adjust their writedowns as mark-to-market is modified, the market saw significant increases in the financial sector. Everywhere I keep hearing the old saw that the market predicts a recovery about six months out, so won't we see a recovery in the fourth quarter of 2009?

If you look at earnings estimates for 2009, that is what is suggested. Bloomberg reports that profits at S&P 500 companies probably fell 38% on average in the first quarter. The stretch of quarterly declines is the longest since at least the Great Depression, data compiled by S&P and Bloomberg show.

Earnings may drop 31% in the second quarter and 18% in the next before gaining 74% in the last three months of the year, analysts predict. Banks are projected to account for all of the rebound in the final quarter. Without financial companies, the gain turns into a 5% decline, the data show.

The above estimates are based on operating earnings, not as-reported earnings. Long-time readers know that operating earnings are actually earnings before interest and Bad Stuff. As-reported earnings are what companies actually report on their tax reports, and as a gauge of profitability they are much more reliable. Before the mid-'90s the difference between operating and as-reported earnings was typically quite small. Then companies found they could play the market if they played games with their operating earnings.

Operating earnings typically do not take into account one-time, nonrecurring events. The number of items which get classified as "nonrecurring" has mushroomed to the point where projected operating earnings for 2009 are more than double the estimates of as-reported earnings. Operating earnings for 2008 were almost three times actual, or as-reported, earnings. We certainly seem to have entered an era of really bad one-time events, which just keep on coming and coming. As recently as 2006, there was less than a 10% difference between the two. In some quarters it was only 5%. A far cry from today's 100%-plus.

Those Wild and Crazy Analysts

Analysts, who as a group have been egregiously bad at predicting earnings of financial stocks for the last two years, would have us believe they are due for a large rise in the 4th quarter. Let's visit those assumptions for a few minutes.

They contend that much of the bad news in the subprime-loan and housing market has been written off. And one would have to admit that a lot has been; and with the relaxation of mark-to-market, there may indeed be some truth to that suggestion. But there are still some issues that remain for housing. Take a look at the graph below. (Not sure where it is from, as it was sent to me, but I have seen the same data elsewhere.) Notice that monthly mortgage-rate resets declined markedly in 2009 from 2008, but are expected to rise again in 2010 and 2011. There is still heartburn in the mortgage market.


The Shadow Inventory of Homes

And foreclosures keep climbing, though some point to that fact that they seem to be leveling off. However, a strange thing is happening. We are seeing what is being called a "shadow inventory" of foreclosed homes.

"We believe there are in the neighborhood of 600,000 properties nationwide that banks have repossessed but not put on the market," said Rick Sharga, vice president of RealtyTrac, which compiles nationwide statistics on foreclosures. "California probably represents 80,000 of those homes. It could be disastrous if the banks suddenly flooded the market with those distressed properties. You'd have further depreciation and carnage." (San Francisco Chronicle)

A Realty Trac survey found that only 30% of foreclosures were listed for sale in real estate listings like the MLS (Multiple Listing Service). Add in homes that people would like to sell but simply can't find buyers for, and must either hold or rent, and the unsold inventory numbers that are public are likely far below actual available homes.

Might some homes in foreclosure be held off the market because banks eventually want to negotiate with the homeowner? Possibly, but other surveys show that anywhere from 30-40% of homes in the foreclosure process in many areas are actually already vacant. There is no one with whom to negotiate.

Typically a foreclosed home sells within a few weeks, as banks take the first "reasonable" offer. But it normally takes about three months from foreclosure to when the home is put on the market— it takes a few months to get a home ready. But surveys show it is taking a lot longer now, and many homes have not made it onto the market, even as more homes are being foreclosed each month.

The Chronicle suggests several factors may be at work. First, there is the "pig-in-the-python" problem. There are just so many homes that it is hard to get them onto the market and sold. Normally there are about 160,000 homes a year in foreclosure sales. We are now seeing 80,000 a month, or six times normal levels, and rising.

Second, lenders could be deferring sales to put off having to acknowledge the actual extent of their losses. "With banks in the stress they're in, I don't think they're anxious to show losses in assets on their balance sheets," one observer said. Finally, banks may not want to flood the market with foreclosures, driving prices down even more. They are simply managing their assets so as to recover the most capital they can.

Given that the graph above says there will be more mortgage misery as large numbers of mortgages reset in the next two years, and given the unknowable nature of the losses, it is somewhat optimistic to think financial profits will rise by 74% in the fourth quarter. But it gets worse.

Commercial Real Estate Starts a Long, Slow Slide

We are now starting to see some real deterioration in traditional bank lending. Delinquencies on home equity loans are rising rapidly. The American Banking Association released a composite index of eight different types of consumer loans, and the delinquency rate on this 35-year-old composite jumped to a record high of 3.22%.

The above reflects 4th-quarter data. As unemployment is up 2% since then and is rising, it is more than reasonable to assume that we will see another record rise in delinquencies this quarter. With unemployment headed to over 10% and maybe 11% from today's 8.5%, delinquencies are likely to continue to rise for the entire year.

David Rosenberg reports that "The National Federation of Independent Business found in a poll that 28% of small firms said they had a line of credit or credit card limit cut back in the second half of last year; 69% stated they are facing worse terms. A new FICO study found that 11% of US consumers— 22 million people— have had their credit lines cut or accounts closed even though they have been paying their bills on time and retain a solid rating." This is certainly not good news for those who expect a positive 4th quarter. Cutting credit to small business, the engine of job growth in the US, is hardly a prescription for a growing economy.

Commercial mortgages are in trouble. S&P has warned they may cut ratings on $97 billion in commercial-mortgage asset-backed debt. The country's 10 biggest banks have $327.6 billion in commercial mortgages, according to regulatory filings. A projected tripling in the default rate would result in losses of about 7% of total unpaid balances, according to estimates from analysts at research firm Reis Inc. (Bloomberg)

I think, given the track record of the analysts who project a 74% rise in earnings for financial stocks in the 4th quarter of this year, that we should remain a tad skeptical. And speaking of earnings, let's go to the S&P web site and see how things are progressing.

But first, let's look at just how badly analysts blew it in estimating 2008 earnings. In the table below we see that as recently as October 15 they were estimating AS-REPORTED earnings to be $54, down from $92 when I first saw the 2008 estimates. There were only two months to go in 2008. So, what are the actual 2008 earnings? Down to $14.88!!!


Not exactly a record to inspire confidence. So, how are we doing in 2009? We see the same pattern. There is a clear deterioration in earnings estimates. Yet, even with the ever lower estimates, they are still projecting nearly a doubling from 2008. Care to make a wager as to what the estimates will look like in a few quarters? Think we will see earnings rise?


P/E Ratios Go Negative!

When we last visited the S&P web site a few weeks ago, the P/E ratio for the quarter ending September 30 was around 181. I must confess that when I looked at it today, as jaded as I am, I was shocked. You can see the numbers for yourself at the site.

The P/E ratio for the end of the second quarter is 1944 (not a typo). The losses of the 4th quarter wipe out almost all earnings for the 12 months ending June 30. But by the end of the 3rd quarter, the estimated P/E ratio has dropped to a (negative) -467. That has never happened. We have never seen negative earnings over a 12-month period since WWII. (I don't have data for the Depression era, or earlier.)

Then as the negative earnings of the 4th quarter of 2008 drop off, we see the estimated P/E ratio rise back to 30, which is quite high. However, if actual earnings come in lower, as I think they will, the P/E ratio will rise and/or the market will fall as negative earnings surprises just keep on coming.

The Effect of Earnings Surprises

As William Hester of Hussman Funds writes in a recent article, the rise and fall of the stock market closely correlates with earnings surprises. Look at the following chart. (You can see the whole article here. I highly recommend it.)

As Hester writes,
"To track the trends in economic performance, we keep an ongoing tally of how data is announced relative to expectations— a method of analysis originally inspired by Bridgewater Advisors. Economic data that surpasses expectations gets added to a 3-month running total. Data that comes in weaker than expected gets subtracted. A rising line means that economic data is generally coming in above expectations, while a falling line means that the data has disappointed. A descending line could be the result of an economy that is not expanding as quickly as economists predict or— as in 2008— it could be the result of an economy that is contracting at a faster rate than expected.


"... Much of the excitement in the stock market— at least that is related to the current performance of the economy— seems to be centered on an economy that is performing less badly than expected. The risks here seem to be that if the trends in data surprises change, so could investors' attitudes toward stocks that are currently overbought on a number of measures.

"... If the high correlation between stock prices and data surprises holds, the recent rally in stocks might be tested. Even if the economy has bottomed, it's very likely that the eventual recovery will prove to be uneven, causing the flow of positive surprises to be uneven. During these periods, the risks to stocks will be greatest when the market is overbought and investors have priced in high expectations of positive data surprises continuing."

The projections of many market analysts assume that we will have something that will look like a normal recovery. I have objected that that could be a very bad assumption, since we are not having a normal recession. This is already a very lengthy recession, and is just going to get longer. As I will note below, there are reasons to think we could see a mild recovery late this year, only to dip back into recession next year.

Corporate Earnings and Recovery in Recessions

Next, let's look at a very interesting chart sent to me by one of my readers, Chad Starliper of Rather and Kittrell in Knoxville, Tennessee. It shows all the cumulative drops in earnings from major peaks, along with the recovery paths. What is interesting is the divergence between the pre- and post-WWII periods. Our experience since 1945 is one of rather quick recoveries, averaging about 3-4 years until earnings rise above the old highs.

The thicker black line shows a drop of 69.2% from peak earnings since 2007. Prior to World War II, it took 12-20 years for earnings to recover. Earnings today are still dropping. As I will point out in the next few e-letters, we live in a world (not just the US) that is in a deep recession. There is massive deleveraging and deflation. The recovery is going to be quite slow, and that portends a slow recovery in earnings, which suggests protracted churning in the stock market. (By the way, for those of you who print out this letter, the next graph will be hard to read if it is not in color.)


Click Here, or on the image, to see a larger, undistorted image.


Even ignoring the disastrous 4th quarter of 2008, what if earnings drop by 80% or more, which is quite possible? That means they have to rise by 400% to get back to new highs. That could take some time. Even if they could rise at an unlikely 24% a year, it would take six years to see new highs. Look at what a mountain corporate earnings must climb.

Consumers are retrenching, and savings rates are likely to rise for at least 3-4 years, back to 7% or more, leaving consumer spending not at 70% of US GDP but closer to 63%. That will be a rather large adjustment, and will mean that a lot of productive capacity will have to be closed or allowed to lie in disuse for a long time. We just built too many strip malls and car factories and restaurants. It is going to take some adjustments.

Further, the Democratic Congress and the Obama administration are going to enact the largest tax increase in history in 2010, just as the economy is barely recovering. The Bush tax cuts go away, because the Republicans could not make them permanent when they had the chance. We are going to pay for that with a likely dip back into a recession in 2010, or at the very least a prolonged weak economy.

The Implosion in Social Security

And then there is the last piece of data I want to bring to your attention, which is the most troubling of all. Everyone knows that the government spends the Social Security surpluses on current needs, "borrowing" the money and putting it into a "Social Security Trust Fund," which is basically just US debt we owe to the trust fund. In other words, there is no trust fund with anything other than paper debt. It is accounting legerdemain.

Everyone assumed that the real problem would come sometime later next decade, when there would no longer be surpluses. In 2008, the Congressional Budget Office (CBO) projected there would be $703 billion in surpluses from 2009-18. Recently, the CBO has revised those estimates downward. It now projects surpluses to be only $83 billion. Here is a table that was sent to me from a blog by Chris Martensen.

Writes Chris, "In the projections for the table (at left), the CBO has assumed no cost of living adjustments (COLAs) in 2010, 2011, or 2012 and a return to economic growth next year. If either of those assumptions proves wrong, the table gets smoked to the downside."

Losing $700 billion (and likely a lot more) out of your budget projections is a huge blow to the US taxpayer. That money is going to have to be borrowed, or spending reduced. But the plans are for huge increases in spending.

In one of the great ironies, the Democrats and the Obama administration are going to have to deal with the Social Security crisis, and soon. Bush tried to do so, and he got torpedoed from both sides of the aisle. Politicians just do not want to be seen doing anything to SS. Given the massive, multi-trillion-dollar deficits that are projected, the US is going to face some difficulty in borrowing to meet those deficits in the not-too-distant future. Is it 3 years? 4? 5? No one can say for certain, but that day is coming and it now appears much closer.

Let's say that US consumers do save 7%. That's almost a trillion a year. The trade deficit dropped to $26 billion last month, as imports continued to drop. That's another $300 billion that foreign central banks could recycle. The Fed could print a few trillion here or there without really pushing up inflation in today's deflationary world.

But there is a limit to continued $2-trillion deficits without the appreciable rise in interest rates that will be needed to attract buyers of Treasury bonds, which of course would increase interest-rate payments on the national debt, while also crowding out corporate and personal borrowing. This is not going to end well, and the end game is getting a lot closer.

All in all, the next few years are going to be a very difficult environment for corporate earnings. To think we are headed back to the 'halcyon' years of 2004-6 is not very realistic. And if you expect a major bull market to develop in this climate, you are not paying attention.

The original question was "Is that recovery we see?" I think the answer is no.

World's Most Important Election

The World's Most Important Election

By Martin Hutchinson April 13, 2009 | 14 April 2009

Relatively little rested economically on the result of last November's U.S. presidential election. John McCain was politically well towards the big-government wing of the Republican party, while President Barack Obama, after an initial burst of public spending will be forced by economic reality to retrench during his remaining years in office. There is, however, an election pending which will have a far more important economic effect on the fate of mankind, causing a fifth of the world's population to remain mired in poverty or to move rapidly towards economic growth and prosperity. That election is in India.

The British colonial 'oppressors' did a fairly decent job in India, but they got one thing horribly wrong: their exit. Apart from causing a civil war with 500,000 casualties, they essentially handed the country on a plate to the leftist Congress Party, run by economic illiterates (not that British economic policy between Neville Chamberlain and Margaret Thatcher was that much better). As a result, India suffered for the next four decades in an economic backwater with around 1% per capita economic growth and an endless proliferation of bureaucracy, the "permit raj."

There was a gradual easing of controls in the 1980s and a somewhat more vigorous one after 1991 under Prime Minister Narasimha Rao and his finance minister Manmohan Singh, but Indian economic growth thereafter appeared to relapse back into its usual torpor until the advent in 1998 of the Bharatiya Janata Party (BJP) government led by Atal Bihari Vajpayee. The Vajpayee government pursued market-opening policies with considerably more vigor than any of its predecessors. The result being that by 2004 Indian growth was running around 8% annually and the country had been included among Goldman Sachs' BRIC group of emerging markets that 'would in future dominate the planet'.

In an exhibition of voter ingratitude unequalled since the British electorate threw out Winston Churchill in 1945, the Indian electorate in 2004 rejected Vajpayee and the BJP so strongly that a Congress-dominated coalition was formed under Manmohan Singh. There was much talk of further economic reform. But in reality reform essentially ceased, although economic growth didn't.

However, like all Congress governments the Manmohan Singh administration proved to be addicted to public spending and fiscal indiscipline. The spending outcome for the 2008-09 fiscal year being fully 20% above the budget estimate for that year. Since most Indian states also run budget deficits, the overall Indian fiscal deficit has widened in the global downturn to around 12% of Gross Domestic Product.

The Economist poll of forecasters predicts Indian growth of 5% in 2009 and 6.4% in 2010. But if the fiscal deficit persists at these levels, that growth will almost certainly be curtailed by financing difficulties. Indian inflation in the 12 months to February ran at 9.6%, while 3-month interest rates are currently at 4.5%.

In spite of India's magnificent export successes in last decade, the current account deficit is already running at 3.7% of GDP. In other words, under present policies the Indian economy is an accident waiting to happen, with an inflationary crisis and seizure of financial markets the most likely form for the breakdown. The rupee is already down 20% against the U.S. dollar in the last year, and could easily collapse if things went wrong enough.

Nevertheless, the potential of the Indian economy remains enormous, if only the country can find a proper government. The announcement last week of Tata Motors' new $2,000 Nano automobile demonstrates why. The combination of a vast supply of extremely cheap labor and a domestic market that can provide manufacturers a large enough domestic market for their products for economies of scale to be achieved is rare.

Outside India and China, emerging market automobile producers have the enormous problem of an inadequate domestic market. They are forced to rely on export markets, in which it is very difficult to achieve enough volume quickly. Malaysia's Proton automobile company had most of the advantages of Tata, but without an adequate domestic market it was never able to expand enough to make itself truly internationally competitive.

However, the Tata saga also demonstrates India's problems. Tata had originally intended to launch the Nano last October, manufacturing it at Singur, in the state of West Bengal. It had obtained permission from the Communist government of West Bengal and had spent $350 million on the plant.

Nevertheless, in early October, it was forced by local protests led by West Bengal's opposition party, the Congress offshoot Trinamool Congress, to abandon the plant and transfer production to a new factory in Gujarat, which will not be ready until 2010. Meanwhile, Tata is being forced to manufacture Nanos at its plant in Pantnagar, a facility that will only allow annual production of 50,000 Nanos, compared with the 250,000 that Tata believed it could sell in its first year (and with 51,000 advance orders in the first ten days from the product's official launch, Tata's estimate of the Nano's sales potential may even have been low.)

The stakes in the Indian election are thus high. At one extreme of possible results, India can continue its progress as an emerging market with Chinese-style growth rates and a population that is expected to exceed China's by 2025. Such an India would be a highly important strategic balance to China, and a magnificent ally for the United States and Europe, balancing China and Russia's authoritarian leanings. Most important, over the next generation, it would lift a fifth of the world's population out of poverty.

At the other extreme, India can suffer a financial crisis that ends the current spurt of growth. Which event would likely be followed by a reversion to the "Hindu rate of growth" leaving the country mired in poverty. And remaining a problem rather than a solution to the world's geopoliticians, with conflict with nuclear-armed Pakistan an ever-present possibility and its myriad inhabitants everlastingly impoverished.

The Indian election takes place in five phases between April 16 and May 13. The chance of the optimal outcome must be reckoned as slender. Vajpayee has retired from politics (he is 85) and the new BJP leader Lal Krishna Advani (himself 81) is not particularly economically oriented and has a history of Hindu extremism that may prove highly off-putting to Moslem voters and somewhat off-putting to moderates. Nevertheless, the reformist former finance minister (2002-04) Jaswant Singh is still active in the party, leading the opposition in the upper house of parliament. He is standing for election in Darjeeling, West Bengal (at 71, he is a stripling by Indian political standards.)

The economic failings of the Manmohan Singh government have not yet become fully apparent. India is in the "stimulus" phase of excessive public spending when it creates spurious economic growth but has not yet run up against the financial constraints, nor made its disadvantage in accelerating inflation and "crowding out" private investment fully apparent. Thus, a BJP absolute majority or a position so close to a majority that it could easily govern with the adherence only of like-minded free-market parties in the National Democratic Alliance, is not very likely.

The most likely outcome is a renewal of the Congress-dominated coalition, which is currently leading in opinion polls, but without an absolute majority. Manmohan Singh would presumably continue as nominal prime minister, although at 76 and in recovery from a January 2009 heart surgery, he may become increasingly a figurehead, deferring to Sonia Gandhi and her son Rahul, 38, the natural next leader of the dynastically-dominated Congress. (Rahul is the son, grandson and great grandson of Congress Party Indian prime ministers).

Since Congress-party is likely to expand only modestly from its current 150 seats (out of 545), even if Manmohan Singh wished to return to his 1990s reformism, he would be unable to do so. Any coalition would likely include the communists or other anti-market elements. Rahul is Western-educated and has worked for the Monitor strategic consultancy, but his family tradition of state control make him an unlikely reformist. Nevertheless, in spite of his youth, he would probably be better able to control the left of a Congress coalition than Manmohan Singh.

Given the weakness of Congress and BJP, it may well be that neither Advani nor Manmohan Singh will be able to form a government. Regional parties may well hold the majority of seats in parliament. A group of those parties, mostly left-oriented, have formed a Third Front, which would most likely ally with Congress, although its leader Mayawati, chief minister of Uttar Pradesh, might be an alternative prime ministerial candidate. Mayawati has held no non-political jobs other than schoolteacher. It is thus interesting that in 2007-08, she was the highest taxpayer among Indian politicians, paying 260 million rupee ($5.2 million) in tax.

It's a pretty grim prospect. The chances are that after the dust clears in mid-May, India will elect another anti-market government, or possibly submerge itself for a couple of years in political squabbling. In either case, its stellar growth record is likely to come to an unpleasant end.

Given the abdication of Russia also from serious pretensions as a growth market, the BRIC group of emerging growth markets will in that event have narrowed itself to BC. [[And that assumes China doesn't pull in its horns and fall back in the direction of a controlled market, as the world recession/depression progresses.: normxxx]] With the United States, Europe and Japan also mired in low growth and excessive budget deficits, the 2010s are shaping up to be a miserable global decade for most all of the world's peoples.

ß§

Normxxx    
______________

The contents of any third-party letters/reports above do not necessarily reflect the opinions or viewpoint of normxxx. They are provided for informational/educational purposes only.

The content of any message or post by normxxx anywhere on this site is not to be construed as constituting market or investment advice. Such is intended for educational purposes only. Individuals should always consult with their own advisors for specific investment advice.

Monday, April 13, 2009

Swiss Slide Into Deflation

Swiss Slide Into Deflation Signals The Next Chapter Of This Global Crisis
Watch Switzerland Closely. It Is Tipping Into Deflation, The First Western Country To Succumb To Japan's Disease.


By Ambrose Evans-Pritchard | 5 April 2009

Swiss consumer prices fell 0.4% in March (year-on-year). Swiss CPI will be minus 1% at least by July, nearing the level where spending psychology changes. By the time you have a self-feeding spiral, it is too late.

"This is something that we must prevent at all costs. The current situation is extraordinarily serious," said Philipp Hildebrand, a governor of the Swiss National Bank.

The SNB is not easily spooked. It is the world's benchmark bank, the keeper of the monetary flame. Yet even the SNB's hard men have thrown away the rule book, taking emergency action to force down the exchange rate of the Swiss franc.

Here lies the danger. If other countries try to export deflation by this means, we will face a second phase of the global crisis. Taiwan is already devaluing. Korea, Singapore, and Sweden all seem tempted to follow. Japan is chomping at the bit.

"We don't fully realise in the West what a catastrophic collapse Japan has suffered," says Albert Edwards, global strategist at Société Générale. "The West has dumped a large part of its economic downturn onto Japan by devaluing against the yen." This is about to go into reverse as Tokyo hits the ping-pong ball back across the net. "As the unfolding collapse in the yen gathers pace, the West will see its green shoots incinerated to dust," he said.

Japan's industrial output fell 38% in February (year-on-year), mostly concentrated into the last four months. No major economy imploded at this speed in the 1930s. The country has been hit by a double shock. As an export power it has taken the brunt of Anglo-Saxon belt-tightening: as the world's top creditor it is cursed by a "safe-haven" currency that soars in moments of danger— largely because the Japanese bring home their wealth till the storm passes. Normally, Japan can cope. This time, the yen's rise has pushed the economy over a cliff.

The yen must come back down to earth, and soon, or Japanese society will start to disintegrate. If necessary, the Bank of Japan will force it down by intervention, as occurred in 2003-2004. Will China stand idly by as Japanese unleashes a shock to the global system through competitive devaluation? That depends whether you think China's spring recovery is the real thing, or an inventory build-up before the next downward slide. The Communist Party says 20m jobs have been lost since the bubble burst. This cannot be tolerated for long.

It is remarkable that China's fall into deflation has attracted so little notice. China's CPI was minus 1.6% in February. The country has built too many factories producing goods that the world cannot absorb. The temptation is to shunt this excess capacity abroad. A faction of the politburo is already itching to devalue the yuan.

Of course, Britain has already played the currency card. That is different. The pound's fall, though welcome, is a side-effect of the Bank of England efforts to stem the credit crunch. There has been no currency intervention.

Crucially, Britain has a current account deficit. Many countries toying with devaluation are exporters with surpluses— 15.4% of GDP for Singapore, 8.4% for Switzerland, and 6.1% for China. If these countries refuse to let their imbalances correct, world demand must implode.

Mr Hildebrand denies that the SNB is pursuing a "beggar-thy-neighbour" strategy. Like the yen, the Swiss franc suffers from the safe-haven curse: everybody buys it in a storm. This tightens monetary conditions. The SNB cannot easily offset this. It has already cut interest rates to near zero. There are not enough Swiss government bonds in the market to rely on the sort of "Quantitative Easing" asset purchases being carried out by the Bank.

Ultimately, I suspect this crisis may mark the moment when the Swiss franc loses its safe-haven role. Credit default swaps (CDS) measuring risk on five-year government debt have reached 127 for Switzerland, higher than Britain at 118. Norway has the world's lowest CDS at 48, reflecting its status as a petro-democracy.

Switzerland's banks are over-leveraged. Loans to emerging markets equal 50% of GDP (half to Eastern Europe). Banking secrecy is dying. Fortunately for the Swiss, they have built up $700bn in net foreign assets for a rainy day. Improvident Britons are less lucky. But that is another story. What we risk now is a game of deflation "pass-the-parcel" worldwide. The economic establishment was caught off guard from 2003 to 2007 because it overlooked the way that Asia's unbalanced relationship with the West was feeding a credit bubble.

It may be caught again as the same warped structure leads to a chain of (panicked) devaluations. Enjoy the "bear-trap" rally on global bourses this spring. But remember, we have only just begun to see the mass lay-offs and hardship caused by this slump. The politicians will act to save their skins. Markets may not like the result.

ß§

Normxxx    
______________

The contents of any third-party letters/reports above do not necessarily reflect the opinions or viewpoint of normxxx. They are provided for informational/educational purposes only.

The content of any message or post by normxxx anywhere on this site is not to be construed as constituting market or investment advice. Such is intended for educational purposes only. Individuals should always consult with their own advisors for specific investment advice.

Only A United Front Can Save The World From Ruin

Only A United Front Can Save The World From Ruin
Industrial Production Is Collapsing Faster Than During The Great Depression. Social And Political Devastation Will Not Be Far Behind, Unless The G20 Can Heal Global Divisions.


By Ambrose Evans-Pritchard, Telegraph.co.uk | 28 March 2009

By the time world leaders gathered to vent their spleens at the London Economic Conference in June 1933, the Slump had already done its worst. Catastrophic policy errors— tight money— had caused the 1930-31 recession to metastasize into debt deflation. Hitler had been let into government with three cabinet seats, enough to give him the Prussian police and Reich interior ministry. It was all he needed.

Any country that tried to reflate alone was punished by creditors. Most stuck grimly to liquidation. Europe and America undercut each other with beggar-thy-neighbour moves on trade and gold. The surplus countries refused to play their part in restoring demand— just as they refuse today, either because they will not (Germany and the Netherlands, who between them have a surplus of $294 billion) or because they cannot for structural reasons (China, $401 billion).

It was impossible for deficit states to fill the breach, so the system folded in on itself. Today, the biggest deficits are: the US ($673 billion), Spain ($155 billion), Italy ($73 billion), France ($57 billion), Greece ($50 billion), Britain ($46 billion). When the Banque de France withdrew gold deposits from New York in October 1931, the US Federal Reserve was forced to raise rates from 1.5 per cent to 3.5 per cent at a terrible moment. It knocked the stuffing out of the US banking system. Needless to say, France was the bigger loser from this petulant act, though that took time to become evident.

The London Conference was a fiasco. President Roosevelt refused to attend. He took a sailing holiday to flag his contempt for Old World posturing. FDR feared a trap to draw America back onto the Gold Standard— the source of the misery— and to lock the White House into Europe's deflation orthodoxies. As delegates waited, he cabled a message mocking the "old fetishes of so-called international bankers". Keynes defended him as "magnificently right".

The London G20 comes earlier in the depression cycle. A good thing too. The fundamental circumstances are worse today than in the early 1930s. The debt burden is higher. The global economy is more tightly intertwined. The virus spreads more swiftly.

Do not be misled by apparent normality. Unemployment lags, and social devastation lags further still– although it has already hit the Baltics and Ukraine. Do not compress the historical time sequence either. Life seemed normal in early 1931 when the press reported "green shoots" everywhere. Part Two of the Depression was the killer. Part Two is what we risk now if we botch it.

Yes, we have done better this time. We saved the credit system [[so far: normxxx]]. Central banks have slashed rates to near zero in half the world's economy. The heroic Bank of England has pioneered monetary stimulus a l'outrance [['to the utmost': normxxx]], even if the ungrateful wretches of this island mock their own salvation. But we must move faster because world manufacturing is collapsing at three times the speed. The damage that occurred from late 1929 to early 1931 has been packed into just six months. Japan's exports fell 49 per cent in January. Holland's CPB Institute says global trade shrank 41 per cent (annualised) from November to January. Industrial output has fallen heavily over the last year: by 31 per cent in Japan, 24 per cent in Spain, 19 per cent in Germany, 17 per cent in Brazil, 13 per cent in Russia and by 11 per cent in the UK and US. Almost all has occurred since September.

In any case, the European Central Bank (ECB) is still standing pat. It is partial to medieval leech-cures— and hamstrung by the lack of EU debt union. Now, if the G20 were to convey the world's wrath at Europe's monetary paralysis, we might get somewhere. But Gordon Brown has been sidetracked by fiscal flammery. We are past that stage. Only the printing presses can rescue us, and the ECB refuses to print. Tactically, Mr Brown erred gravely by promising "the biggest fiscal stimulus the world has ever seen". It is not his gift, and comes ill from a deadbeat state that cannot sell its own bonds.

There again, was it wise for the Czech premier and titular EU president to rubbish Barack Obama's fiscal blitz as the "road to hell"? That too comes ill from a leader who has just lost a no-confidence vote over his handling of the Czech economy. But the hapless Bohemian speaks for Europe, where Hooverism is written into EU Treaty law. Indeed, last week Brussels fired anathemae at Greece, Spain, France, Britain and Ireland, for breach of the 3 per cent deficit rule. We must retrench under Regulation 1466/97. Laugh not.

Germany's finance minister, Peer Steinbruck, is still digging in his heels against "crass Keynesianism". No matter that his economy will shrink 6-7 per cent this year. Germans must sweat it out: some more than others. Unemployment may reach five million in 2010. No doubt spending is a poor instrument, and we are all sick of bail-outs. But Mr Steinbruck might brush up on history. It was the deflation of 1930-1932— not the hyperinflation of 1923— that killed Weimar democracy. (Communists and Nazis won half the Reichstag seats in July 1932). The neo-Marxist Linke Party is already angling for 30 per cent in June's Thuringia poll.

You may agree with Mr Steinbruck. Fine. Capitol Hill does not. The most protectionist Congress since Bretton Woods is not going to acquiesce as precious US stimulus leaks abroad to the benefit of "free-riders". Patience will snap. "Buy American" is already US law.

The risk is that G20 action or non-action becomes the defining moment when a disgusted American political class— sorely provoked— turns its back on the open trading system. The US alone has the strategic depth to clear its own path, and might find eager partners in a "pro-growth bloc"— much as Britain led a reflation bloc behind Imperial Preference in the early 1930s. As the world's top exporters, Germany and China should take great care to restrain from further agravating their customers.

Well done, Mr Brown, for trying to hold the world together. But if 'world rescue' degenerates into a shouting match between mercantilist creditors and prostrate debtors, it may serve only to frighten markets further and tip us into the next— more violent— downward leg of this slump.

ß§

Normxxx    
______________

The contents of any third-party letters/reports above do not necessarily reflect the opinions or viewpoint of normxxx. They are provided for informational/educational purposes only.

The content of any message or post by normxxx anywhere on this site is not to be construed as constituting market or investment advice. Such is intended for educational purposes only. Individuals should always consult with their own advisors for specific investment advice.

Sunday, April 12, 2009

Why Israel Will Bomb Iran

Why Israel Will Bomb Iran
The Rational Argument For An Attack.

Click here for a link to ORIGINAL article: (See ORIGINAL article for further links & references.)

By David Samuels, Slate | 9 April 2009

The more Israeli leaders huff and puff about their determination to stop Iran's nuclear program, the more sophisticated analysts are inclined to believe that Israel is bluffing. After all, if George W. Bush refused to provide Israel with the bunker busters and refueling capacity to take out Iran's nukes in 2008, the chance that Barack Obama will give Israel the green light anytime soon seems quite remote— this being the same President Obama who greeted North Korea's recent missile launch with a speech outlining his plan to dismantle America's nuclear arsenal on the way to realizing his dream of a nuclear-free world.

Israel's performance in the 2006 war in Lebanon was widely depicted as catastrophic, and with Israel's diplomatic standing hitting new lows after the stomach-turning images of destruction from Gaza, the diplomatic consequences of a successful attack on Iranian nuclear facilities might be worse than the prospect of military failure. There is also the fact that no one knows exactly where Iran's nuclear assets are.

Many perfectly reasonable people chalk up the rhetorical excesses of both parties to the hot desert sun and assume that nothing particularly awful will happen whether Iran becomes a nuclear power or not. From a U.S. point of view, at least, there is little reason to doubt the analysis that a nuclear Iran with a few dozen bombs can be contained at relatively limited cost using the same strategies that successfully constrained an aggressive Soviet Empire armed with nearly 45,000 nuclear warheads at the height of the Cold War.

What the nuclear optimists miss is that it is not the United States that is directly threatened by the Iranian nuclear program, but Israel— and the calculations that drive our Middle Eastern client state are very different from those that guide the behavior of its superpower patron. Less sanguine types— who think that Israel isn't bluffing— generally fall into two camps: those who think that the Israelis are crazy and require the firm hand of America to restrain them and those who think that the Iranian leadership lives on a different planet and will use nuclear weapons against Israel. Yet it is not necessary to stipulate that either party is crazy in order to see why an Israeli attack on Iran makes sense.

From the standpoint of international relations theory, the scariest thing about recent Israeli rhetoric is that an attack on Iran lines up quite well with Israel's rational interests as a superpower client. While Israeli bluster is clearly calculated to push America to take a more aggressive stance toward Iran, that doesn't mean the Israelis won't actually attack if President Obama decides on a policy of engagement that leaves the Iranians with a viable nuclear option.

In fact, the more you consider the rationality of an Israeli attack on Iran in the context of Israel's relationship with its superpower patron, the more likely an attack appears. Given Iran's recent technological triumphs, like the launch of the Omid communications satellite earlier this year and the lack of ambiguity about the aims of the Iranian nuclear program, it is hardly apocalyptic to expect an attack within the next year— assuming that the Russians continue to dither about delivering S-300 surface-to-air missiles to protect Iranian nuclear sites. A stepped-up delivery date for large numbers of S-300 missiles could lead to an earlier attack.

The fact that U.S. and Israeli interests with regard to Iran may diverge in radical ways comes as a surprise to many mainstream analysts. The tendency among both supporters and opponents of America's "special relationship" with Israel is to invoke various forms of mind-bending mumbo-jumbo— from dimwitted theories about an all-powerful Jewish conspiracy to childlike evocations of the community of democratic values that unites the two countries. While America's embrace of Israel is partially motivated both by shared values and by the lobbying power of an influential minority group, neither Israel's creaky democratic polity nor the hidden persuasive powers of AIPAC can claim much credit for the billions of dollars in American military credits that Israel enjoys…. A vast corporate welfare program that benefits Pentagon defense contractors as much as it benefits Israel's military.

The key fact of the American-Israeli alliance that most commentators seem eager to elide is that Israel is America's leading ally in the Middle East because it is the most powerful country in the Middle East. Critics of the American-Israeli relationship love to conflate American support for Israel before 1967 with America's support since then by citing statistics for tens of billions of dollars in U.S. military credits and aid given to Israel "since 1948," when the Jewish State was founded. In fact, Israel's rise to becoming a regional superpower was accomplished without any significant help from United States.

Israel's surreptitious program to build nuclear weapons was accomplished with the aid of the British and the French, who joined with Israel to seize the Suez Canal from Egypt's rabble-rousing President Gamal Abdel Nasser, and who were then forced to give it back by Dwight D. Eisenhower. The Israeli air force pilots who destroyed the Egyptian, Syrian, and Jordanian air forces on the ground flew French-made Mystère jets— not American-made F-4 Phantoms. The U.S. Congress did not appropriate a single penny to help Israel accommodate an overwhelming influx of Holocaust survivors and poor Jewish refugees from Yemen, Iraq, Egypt, and other Arab countries until 1973— 25 years after the founding of the state.

By shattering the old balance of power in the Middle East with its spectacular military victory in the Six Day War, Israel announced itself to America as the reigning military power in the region and as a profoundly destabilizing influence that needed to be contained. The parallels between Israel's rise to superpower-client status in the 1950s and 1960s and the Iranian march toward regional hegemony over the past decade are quite striking. Both Israel circa 1967 and modern-day Iran are non-Arab non-Sunni states that used innovative military tactics to panic the Arabs.

Yet Iran is a non-Arab Muslim country (even if mostly Sheite Persian in a mostly Sunni Arab ME), with a population of more than 70 million. Israel was and is a tiny non-Arab, non-Muslim country (who can count on no more— and probably less— aid from a Christian Europe than the Lebanese and Iraqi Christians) whose small population and seat-of-the-pants style of leadership made even the country's modest colonial ambitions seem like a stretch. In the absence of any fixed plan of expansion, or any long-term plan for dealing with its neighbors, Israel decided to use its excess military power and captured lands as a chit that it could exchange for resources provided from outside the region by its wealthy American 'patron'.

Israel earned its role as an American client with a series of daring military victories won by a tiny embattled country with a shoestring budget and its back against the sea: the capture of the Suez Canal from Nasser in 1956, the audacious victory in 1967, and the development of a nuclear bomb. Yet the terms of the bargain that Israel struck would necessarily relegate such accomplishments to the history books. Israel traded its freedom to engage in high-risk, high-payoff exploits like the Suez Canal adventure or the Six Day War for the comfort of a military and diplomatic guarantee from the wealthiest and most powerful nation in the world.

As a regional American client, Israel would draw on the military and diplomatic power of its distant patron in exchange for allowing America to use its control over Israel as leverage with neighboring Arab states. With each American-brokered peace move— from Camp David to the Madrid Conference to Oslo and Annapolis— the United States has been able to hold up its leverage over Israel as both a carrot and a stick to the Arab world. Do what we want, and we will force the Israelis to behave.

The client-patron relationship between the United States and Israel that allows Washington to control the politics of the Middle East is founded on two pillars: America's ability to deliver concrete accomplishments, like the return of the Sinai to Egypt and the pledge to create a Palestinian state, along with the suggestion that Washington is manfully restraining wilder, more aggressive Israeli ambitions. The success of the American-Israeli alliance demands that both parties be active partners in a complex dance that involves a lot of play-acting— America pretends to rebuke Israel, just as Israel pretends to be restrained by American intervention from bombing Damascus or seizing the banks of the Euphrates. The instability of the U.S.-Israel relationship is therefore inherent in the terms of a patron-client relationship that requires managing a careful balance of Israeli strength and Israeli weakness.

An Israel that runs roughshod over its neighbors is a liability to the United States— just as an Israel that lost the capacity to project destabilizing power throughout the region would quickly become worthless as a client. A corollary of this basic point is that the weaker and more dependent Israel becomes, the more Israeli interests and American interests are likely to diverge. Stripped of its ability to take independent military action, Israel's remaining value to the United States can be seen to reside in its ability to give the Golan Heights back to Syria and to carve out a Palestinian state from the remaining territories it captured in 1967.

Thereafter it would be left with only the territories of the pre-1967 state to barter for a declining store of U.S. military credits, which Washington might prefer to spend on wooing Iran. The untenable nature of this strategic calculus gives a cold-eyed academic analyst all the explanation she needs to explain Israel's recent wars against Hezbollah and Hamas, its assassinations of Iranian nuclear scientists and engineers, and its 2007 attack on the Syrian nuclear reactor. Israel's attempts to restore its perceived capacity for game-changing independent military action are directed as much to its American patron as to its neighbors.

Former Prime Minister Ariel Sharon established Israel's current strategic posture. Sharon alternated strong, unpredictable military actions like Operation Defensive Shield and the final isolation of Yasser Arafat with invocations of the importance of peace and surprising concessions, such as the unilateral Israeli withdrawal from Gaza in 2005. Sharon also took care to balance his close relationship with President Bush with a program of diplomatic outreach to second-tier powers like Russia and India.

An attack on Iran might be risky in dozens of ways, but it would certainly do wonders for restoring Israel's capacity for game-changing military action. The idea that Iran can meaningfully retaliate against Israel through conventional means is more myth than fact. Even without using nuclear weapons, Israel has the capacity to flatten the Iranian economy by bombing a few strategic oil refineries, making a meaningful Iranian counterstroke much less likely than it first appears.

If the 2006 Lebanon war showed the holes in Israel's ability to fight a conventional ground war, it also showed the ability of the Israeli air force to destroy long-range missiles on the ground. Israel's response to fresh barrages of missiles from Hezbollah and Hamas while engaged in a shooting war with Iran would presumably be even less restrained than it has been in the past. Short of an Iranian-hostage-rescue-mission-type debacle in which a small Israeli tactical force crashes in the Iranian desert, or a presidential order from Obama to shoot down Israeli planes on their way to Natanz, any Israeli air raid on Iran is likely to succeed in destroying masses of delicate equipment that the Iranians have spent a decade building at enormous cost in time and treasure.

It is hard to believe that Iran could quickly or easily replace what it lost. Whether it resulted in delaying Iran's march toward a nuclear bomb by two years, five years, or somewhere in between, is relatively inconsequential. The most important (strategic) result of an Israeli bombing raid would be to puncture the myth of inevitability that has come to surround the Iranian nuclear project and that has fueled Iran's rise as a regional hegemon (and seemingly already conceded by a reluctant EU).

The idea of a mass public outcry against Israel in the Muslim world is probably also a fiction— given the public backing of the Gulf states and Egypt for Israel's wars against Hezbollah and Hamas. As the only army in the region able to take on Iran and its clients, Israel has effectively become the hired army of the Sunni Arab states tasked by Washington with the job of protecting America's favorite Middle Eastern tipple— oil. The parallels between Israel's rise to superpower client status after 1967 and Iran's recent rise offer another strong reason for Israel to act— and act fast.

The current bidding for Iran's favor is alarming to Israel not only because of the unfriendly proclamations of Iranian leaders but because of what an American rapprochement with Iran signals for the future of Israel's status as an American client. While America would probably benefit by playing Israel and Iran against each other for a while to extract the maximum benefit from both relationships, it is hard to see how America would manage to please both clients simultaneously in the long run. But, it is quite easy to imagine a world in which Iran— with its influence in Afghanistan and Iraq, its control over Hezbollah and Hamas, and easy access to leading members of al-Qaida— would be the partner worth pleasing.

Bombing Iran's nuclear facilities is the surest way for Israel to restore the image of strength and unpredictability that made it valuable to the United States after 1967 while also eliminating Iran as a viable partner for America's favor. The fact that this approach may be the international-relations equivalent of keeping your boyfriend by shooting the other cute girl he likes in the head is an indicator of the difference between high-school romance and alliances between states— and hardly an argument for why it won't work. Shorn of its nuclear program and unable to retaliate against Israel through conventional military means, Iran would be shown to be a paper tiger— to the not-so-secret delight of America's Sunni Arab allies in the Gulf.

Iran's local clients like Syria and Hamas would be likely to distance themselves from an over-leveraged Persian would-be hegemon whose ruined nuclear facilities would be visible on Google Earth. The only real downside for Israel of an attack on Iran is Washington's likely response to the anger of the Arab street and the European street, both of which are likely to express their fierce outrage against Israel and the United States. The price of an Israeli attack on Iran is therefore clear to anyone who reads Al Ahram or the Guardian: a Palestinian state.

It seems fair to say that both Israeli Prime Minister Benjamin Netanyahu and Defense Minister Ehud Barak see the establishment of some kind of Palestinian state as inevitable and also as posing real security risks to Israel. Yet, in a perverse way, the idea that the price of an attack on Iran will be the establishment of a Palestinian state makes the logic of such an attack even clearer. Israel's leaders know that the security threats inherent in giving up most of the West Bank will be greatly augmented or diminished depending on how a Palestinian state is born.

A Palestinian state born as the result of Israeli weakness is a much greater danger to Israel than a state born out of Israeli strength. Ariel Sharon was able to withdraw from Gaza because he defeated Arafat and crushed the second intifada. Desperate to rid themselves of the bad PR and the demographic threat posed by maintaining Israel's hold over the West Bank, Sharon's successors have been unable to find a victory big enough to allow them to retreat.

Nor are they able to reconcile themselves to the threat posed by images of a defeated Israel being forced to withdraw from Hebron and Nablus by triumphant Palestinian militias backed by Iran. The inevitability of a future Palestinian state is the most powerful argument for the inevitability of an Israeli attack on Iran— unless the Iranian nuclear program is stopped by other means. Taking out the Iranian nuclear program is the one obvious avenue by which Israel can turn the debilitating drip-drip-drip of territorial giveaways and international condemnation into a convincing appearance of strength.

Destroying a respectable number of Iranian centrifuges will end Iran's march to regional hegemony and eliminate Israel's chief rival for America's affections while also allowing Israel to gain the legal and demographic benefits of a Palestinian state with a minimum of long-term risk. Israel's version of a nuclear grand bargain that brings peace to the Middle East may be messier and more violent than what the Obama administration imagines can be accomplished through sanctions, blandishments, and the invocation of Barack Obama's magic middle name. But who can really argue with the idea of trading the Iranian nuclear bomb for a Palestinian state?

Saudi Arabia would be happy. Egypt would be happy. Bahrain, Kuwait, and the United Arab Emirates would be happy. Jordan would be happy. Iraq would be happy. Two-thirds of the Lebanese would be happy. The Palestinians would go about building their state, and Israel would buy itself another 40 years as the only nuclear-armed country in the Middle East. Iran would not be happy.

But who said peace won't have a price?

  M O R E. . .

Normxxx    
______________

The contents of any third-party letters/reports above do not necessarily reflect the opinions or viewpoint of normxxx. They are provided for informational/educational purposes only.

The content of any message or post by normxxx anywhere on this site is not to be construed as constituting market or investment advice. Such is intended for educational purposes only. Individuals should always consult with their own advisors for specific investment advice.

Saturday, April 11, 2009

The Fundamentals Of Market Bottoms

The Fundamentals Of Market Bottoms
Fundamentals Of Residential Real Estate Market Bottoms


By David J. Merkel, CFA, FSA.

Before I start this piece, I have to deal with the issue of why equity market tops and bottoms are different. Tops and bottoms are different primarily because of debt and options investors. At market tops, typically credit spreads are tight, but they have been tight for several years, while seemingly cheap leverage builds up. Option investors get greedy on calls near tops, and give up on or even short puts. Implied volatility is low and stays low. There is a sense of invincibility for the equity market, and the bond and option markets reflect that.

Bottoms are more jagged, the way corporate bond spreads are near equity market bottoms. They spike multiple times before the bottom finally arrives. Investors similarly grab for puts many times before the bottom arrives. Implied volatility is high and jumpy.

As a friend of mine once said, "To make a stock go to zero, it has to have a significant slug of debt." That is what differentiates tops from bottoms. At tops, no one cares about debt or balance sheets. The only insolvencies that happen then are due to fraud [[or incompetence: normxxx]]. But at bottoms, the only thing that investors care about is debt or balance sheets. In many cases, the corporate debt behaves like equity, and the equity is as jumpy as an at-the-money leap or warrant.

I equate bond spreads and option volatility because contingent claims theory views corporate bondholders as having sold a put option to the equityholders. In other words, the bondholders receive a company when in default, but the equityholders hang onto it in good times. Though this piece is about bottoms, not tops, I am going to use an old CC post of mine on tops to illustrate a point.


Housing Bubblettes, Redux 10/27/2005

From my piece, "Real Estate’s Top Looms":

Bubbles are primarily a financing phenomenon. Bubbles pop when financing proves insufficient to finance the assets in question. Or, as I said in another forum: a Ponzi scheme needs an ever-increasing flow of money to survive. The same is true for a market bubble. When the flow’s growth begins to slow, the bubble will wobble. When it stops, it will pop. When it goes negative, it is too late.

As I wrote in the column on market tops: Valuation is rarely a sufficient reason to be long or short a market. Absurdity is like infinity. Twice infinity is still infinity. Twice absurd is still absurd. Absurd valuations, whether high or low, can become even more absurd if the expectations of market participants become momentum-based. Momentum investors do not care about valuation; they buy what is going up, and sell what is going down.

I’m not pounding the table for anyone to short anything here, but I want to point out that the argument for a bubble does not rely on the amount of the price rise, but on the amount and nature of the financing involved.
That financing is more extreme today on a balance sheet basis than at any point in modern times. The average maturity of that debt to repricing date is shorter than at any point in modern times.

That’s why I think the hot coastal markets are bubblettes.
My position hasn’t changed since I wrote my original piece.

Position: none

I had a shorter way of saying it: Bubbles pop when cash flow is insufficient to finance them. But what of market bottoms? What is financing like at market bottoms?

The Investor Base Becomes Fundamentally-Driven

1) Now, by fundamentally-driven, I don’t mean that you are just going to read lots of articles telling how cheap certain companies are. There will be a lot of articles telling you to "stay away from all stocks because of the negative macroeconomic environment", and, they will be shrill.

2) Fundamental investors are quiet, and valuation-oriented. They start quietly buying shares when prices fall beneath their threshold levels, coming up to full positions at prices that they think are bargains for any environment.

3) But at the bottom, even long-term fundamental investors are questioning their sanity. Investors with short time horizons have long since left the scene, and investor with intermediate time horizons are selling. In one sense investors with short time horizons tend to predominate at tops, and investors with long time horizons dominate at bottoms.

4) The market pays a lot of attention to shorts, attributing to them powers far beyond the capital that they control.

5) Managers that ignored credit quality have gotten killed, or at least, their assets under management are much reduced.

6) At bottoms, you can take a lot of well financed companies private, and make a lot of money in the process, but no one will offer financing then. M&A volumes are small.

7) Long-term fundamental investors who have the freedom to go to cash begin deploying cash into equities, at least, those few that haven’t morphed into permabears.

8) Value managers tend to outperform growth managers at bottoms, though in today’s context, where financials are doing so badly, I would expect growth managers to do better than value managers.

9) On CNBC, and other media outlets, you tend to hear from the "adults" more often. By adults, I mean those who say "You should have seen this coming. Our nation has been irresponsible, yada, yada, yada." When you get used to seeing the faces of David Tice and James Grant, we are likely near a bottom. The "chrome dome count", showing more 'older' investors on the tube is another sign of a bottom.

10) Defined benefit plans are net buyers of stock, as they rebalance to their target weights for equities.

11) Value investors find no lack of promising ideas, only a lack of capital.

12) Well-capitalized investors that rarely borrow, do so to take advantage of bargains. They also buy sectors that are rarely attractive to them, but figure that if they buy and hold for ten years, they will end up with something better.

13) Neophyte investors leave the game, alleging the the stock market is rigged, and put their money in something that they understand that is presently hot— e.g. money market funds, collectibles, gold, real estate— they chase the next trend in search of easy money.

14) Short interest reaches high levels; interest in 'hedged strategies' reaches manic levels.

Changes In Corporate Behavior

1) Primary IPOs don’t get done, and what few that get done are only of the highest quality. Secondary IPOs get done to reflate damaged balance sheets, but the degree of dilution is poisonous to the stock prices.

2) Private equity holds onto their deals longer, because the IPO exit door is shut. Raising new money is hard; returns are low.

3) There are more earnings disappointments, and guidance goes lower for the future. The bottom is close when disappointments hit, and the stock barely reacts, as if the market were saying "So what else is new"?

4) Leverage is significantly reduced, and companies begin talking about how strong their balance sheets are. Weaker companies talk about how they will make it, and that their banks are on board, committing credit, waiving covenants, etc. The weakest die. Default rates spike during a market bottom, and only when prescient investors note that the amount of companies with questionable credit has declined to an amount that no longer poses systemic risk, does the market as a whole start to rally.

5) Accounting tends to get cleaned up, and operating earnings become closer to net (GAAP) earnings.As business ramps down, free cash flow begins to rise, and becomes a larger proportion of earnings.

6) Cash flow at stronger firms enables them to begin buying bargain assets of weaker and bankrupt firms.

7) Dividends stop getting cut on net, and begin to rise, and the same for buybacks.

8) High quality companies keep buying back stock, not aggresssively, but persistently.

Other Indicators

1) Implied volatility is high, as is actual volatility. Investors are pulling their hair, biting their tongues, and retreating from the market. The market gets scared easily, and it is not hard to make the market go up or down a lot.

2)The Fed adds liquidity to the system, and the response is sluggish at best. By the time the bottom comes, the yield curve has a strong positive slope.

No Bottom Yet

There are some reasons for optimism in the present environment. Shorts are feared. Value investors are seeing more and more ideas that are intriguing. Credit-sensitive names have been hurt. The yield curve has a positive slope. Short interest is pretty high. But a bottom is not with us yet, for the following reasons:

  • Implied volatility is low.

  • Corporate defaults are not at crisis levels yet.

  • Housing prices still have further to fall.

  • Bear markets have duration, and this one has been pretty moderate so far [[considering the damage: normxxx]].

  • Leverage hasn’t decreased much. In particular, the investment banks need to de-lever, including the synthetic leverage in their swap books.

  • I don’t sense true panic among investors yet. Not enough neophytes have left the game.

Not all of the indicators that I put forth have to appear for there to be a market bottom. A preponderance of them appearing would make me consider the possibility, and that is not the case now.

Some of my indicators are vague and require subjective judgment. But they’re better than nothing, and kept me in the game in 2001-2002. I hope that I— and you— can achieve the same with them as we near the next bottom.

For the shorts, you have more time to play, but time is running out till we get back to more ordinary markets, where the shorts have it tough. Exacerbating that will be all of the neophyte shorts that have piled on in this bear market. This includes retail, but also institutional (130/30 strategies, market neutral hedge and mutual funds, credit hedge funds, and more). There is a limit to how much shorting can go on before it becomes crowded, and technicals start dominating market fundamentals. In most cases, (i.e. companies with moderately strong balance sheets) shorting has no impact on the ultimate outcome for the company— it is just a side bet that will eventually wash out, following the fundamental prospects of the firm.

As for asset allocators, time to begin edging back into equities, but I would still be below target weight.

The current market environment is not as overvalued as it was a year ago, and there are some reasonably valued companies with seemingly clean accounting to buy at present. That said, long investors must be willing to endure pain for a while longer, and take defensive measures in terms of the quality of companies that they buy, as well as the industries in question. Long only investors must play defense here, and there will be a reward when the bottom comes.

========================================

Fundamentals Of Residential Real Estate Market Bottoms

By David J. Merkel, CFA, FSA.

This piece asks whether we are at the bottom for Residential Real Estate (RRE) prices. If not, then when, and how much more pain?

Before I start this piece, I have to deal with the issue of why RRE market tops and bottoms are not symetric. The signals for a bottom are not simply the inverse of those for a top. Tops and bottoms for RRE are different primarily because of debt investors. At market tops, credit spreads are typically tight, but they have been tight for several years, while seemingly cheap leverage builds up. There is a sense of invincibility for the RRE market, and the financing markets reflect that. Bottoms are more jagged, with debt financing expensive to non-existent.

To make RRE go to zero, it has to have a significant slug of debt. That is what differentiates tops from bottoms. At tops, no one cares about the level of debt or financing terms. The rare insolvencies that happen then are often due to fraud. But at bottoms, the only thing that investors care about is the level of debt or financing terms.

Why Do RRE Defaults Happen?

It costs money to sell a home— around 5-10% of the sales price. In a RRE bear market, those costs fall entirely on the seller. That’s why economic incentives for the owners of RRE decline once their equity on a mark-to-market basis declines below that threshold. They no longer have equity so much as a put option on the putative 'value' of the home, should they continue to pay on their mortgage.

As RRE prices have fallen, a larger percentage of the housing stock has fallen below the 10% equity threshold. Near the peak in October 2005, maybe 5% of all houses were below the threshold. Recently, I estimated that that figure was closer to 15%. It may go as high as 20% by the time we reach bottom.

Defaults occur in RRE when there would be negative equity in a sale, and a negative life event occurs:

  • Unemployment

  • Death

  • Disability

  • Disaster

  • Divorce

  • Large mortgage payment rise from a reset or a recast

These negative life events, which, aside from changes in mortgage payments, can’t be expected, cause the borrower to give up and default. During a RRE bear market, most people in a negative equity on sale position don’t have a lot of extra assets to fall back on, so anything that interrupts the normal flow of income raises the odds of default. As long as there are a large number of homes in a negative equity on sale position, a certain percentage will keep sliding into foreclosure when negative life events hit. For any individual, it is random, but for the US as a whole, a predictable flow of foreclosures occur.

Examining Economic Actors As We Near The Bottom

Starting at the bottom of the housing "food chain," I’m going to consider how various parties act as we get near the RRE price bottom. At the bottom, typically Federal Reserve policy is loose, and the yield curve is very steep. Financial companies, if they are in good shape, can profit from lending against their inexpensive deposit bases.

This presumes that the remaining banks are in good shape, with adequate capacity to lend. That’s not true at present. Regulation has moved into triage mode, where the regulators are "stress testing" to divide the institutions into healthy, questionable, and dead. The bottom typically is not reached until the number of questionable institutions starts to shrink. Right now that figure is growing for banks, thrifts, and credit unions.

The Fed’s monetary policy can only stimulate the healthy institutions. Over time, many of the questionable will slow growth, and build up enough free assets to write off bad debts. Those free assets will come through capital raises and modest profitability. Others will fail, and their assets will be taken over by stronger institutions, and losses realized by the FDIC, etc. The FDIC, and other insurance funds, will have their own balancing act, as they will need to raise premiums, but not so much that it harms borderline institutions.

Another tricky issue is the Treasury-Eurodollar [TED] Spread. Near the bottom, there should be significant uncertainty about the banking system, and the willingness of banks to lend to each other. Spreads on corporate and trust preferreds should be relatively high as well. Past the bottom, all of these spreads should be rallying for the surviving institutions.

Financing for purchasing a house in a RRE bear market is expensive to nonexistent, but the underwriting is strong. At the bottom, volumes increase as enough buyers have built up sufficient earning power and savings to put a decent amount down, and be able to comfortably finance the balance at the new reduced housing prices, even with relatively high mortgage rates relative to where the government borrows.

Many other players in RRE financing will find themselves stretched, and some will be broken. Consider:

1) The number of home equity lenders will be greatly reduced, and won’t increase until well after the bottom is passed.

2) Many unregulated and liberally regulated lenders are out of business. The virtue of a strong balance sheet and a deposit franchise speaks for itself.

3) Buyers of subordinated RMBS have been destroyed; same for many leveraged players in "high quality" paper. Don’t even mention subprime; that game is over, and may even be turning up now as vultures pick through the rubble. This has implications for MBIA, Ambac, and other financial guarantors, since they guaranteed similar business. How big will their losses be?

4) Mortgage insurers are impaired. In earlier RRE bear markets, that meant earnings went negative for a while. In this case, one has failed, and some more might fail as well.

5) Do the GSEs continue to exist in their present form? That question never came up in prior bear markets, but it will have to be answered before the this bottom arrives. Will the FHLB take losses from their mortgage holdings? Will it be severe enough that it affects their creditworthiness? I doubt it, but anything is possible in this down cycle, and the FHLBs have absorbed a lot of RRE mortgage financing.

6) Securitization gets done in very limited fashion, if at all. This is already true for non-GSE-insured loans; the question is how much Fannie and Freddie will do. My suspicion is near the bottom, as loan volumes increase, banks will be looking for ways to move mortgages off of their balance sheets, and securitization should increase [[probably with guarantees: normxxx]].

7) The losses have to go somewhere, which brings up one more player, the US Government. Through the institutions the US sponsors, and through whatever mélange of programs the US uses to directly or indirectly bail out financially broken individuals and institutions, a lot of the pain will get directed back to taxpayers, and, those who lend to the US government in its own currency. It is possible that foreign lenders to the US may rebel at some point, but if the OPEC nations in the Middle East or China haven’t blinked by now, I’m not sure what level of current account deficit would make them change their policy.

That said, the recent housing bill was probably too little too late. Look for the US Government to try again, probably later in the year.

A Few More Economic Actors To Consider

Now let’s consider the likely actions of parties that are closer to the building and buying of houses.

1) Toward the bottom, or shortly after that, we should see an increase in speculative buying from investors. These will be smarter speculators than the ones buying in 2005; they will not only not rely on capital gains in order to survive, but they require a risk premium. Renting the property will have to generate a very attractive return in order to get one to buy the property.

2) Renters will be doing the same math and will begin buying in volume when they can finance it prudently, and save money over renting.

3) At the bottom, only the best realtors are left. It’s no longer a seemingly "easy money" profession.

4) At the bottom, only the best builders survive, and typically they trade for 50-125% of their written-down book value. Leverage declines significantly. Land gets written down. JVs get rationalized. Fewer homes get built, so that inventories of unsold homes finally decline.

As for current homeowners, the mortgage resets and recasts have to be past the peak at the bottom, with the end in sight. (In my piece on real estate market tops, I suggested that after the bubble popped "Short rates would have to rally significantly to bail these borrowers out. We would need the fed funds target at around 2%." Well, we are past there, but I didn’t expect the TED spread to remain so high.)

5) Defaults begin burning out, because the number of properties in a negative equity on sale position begins to decline.

6) Places that had the biggest booms have the biggest busts, even if open property is scarce. Remember, a piece of land is not priceless, but is only worth the subjective present value of future services that can be derived from the land to the marginal buyer. When marginal buyers are nonexistent, and lenders are skittish, prices can fall a long way, even in supply-constrained markets. [[Californians, pay heed!: normxxx]]

For a parallel, consider pricing in the art market. Many pieces of art are priceless, but the market as a whole tends to follow the liquidity of the rich marginal art buyer. When liquidity is scarce, prices tend to fall, though it is often masked by a lack of trading in an illiquid market.

When financing expands dramatically in any sector, there is a tendency for the assets being financed to appreciate in value in the short run. This was true of the Nasdaq in the late '90s, commercial real estate in the mid-to-late 1980s, lesser-developed-country lending in the late '70s, etc. Financing injects liquidity, and liquidity creates confidence in the short run, which can become self-reinforcing, until the cash flows can’t support the assets in question, and then the markets become self-reinforcing on the downside, as buying power collapses.

The Bottom Is Coming, But I Wouldn’t Get Too Happy Yet

There are reasons to think that we are at or near the bottom now:

• Sales are increasing in a number of areas where foreclosures are significant.

• What little lending is being done is being done on relatively sound terms.

• Securitization has slowed dramatically.

• The major homebuilders are trading for 50-125% of book value, generally. The question is how much remains to be written down.

• New home sales have slowed dramatically. Homebuilder confidence is low and new construction has slowed to a crawl.


But I don’t think we are there yet, and here is why:

• Foreclosures are still increasing.

• Mortgage stress seems to be increasing in
prime and prime jumbo loans [[and there are still a slew of ARMs which will reset by the end of this year and 2010!: normxxx]].

• The inventory of unsold homes continues to rise. At the bottom, inventories will have started to shrink, but are not yet to 'normal' inventory levels. (There is also significant dark supply, or shadow inventory as well, which will feed into the market as prices stabilize or even rise.)

• The inventory of depository financial institutions in trouble [[including FHLBs: normxxx]] continues to rise. Regulatory triage is only beginning.

• We still have a lot of payment resets and recasts to go through. (
My, but those option ARMs are ugly.)

• FOMC policy is not providing a lot of liquidity to the economy as a whole, but only to a few lending markets.

• The future of the GSEs, mortgage insurers, and financial guarantors are still up in the air.

• The US Government will try some more policy ideas as the one's tried 'fail to meet the test'.

• We aren’t seeing a lot of speculative buying yet. [[Huge RE interests are waiting to pounce the minute they think a solid bottom has been reached.: normxxx]]

• The biggest regional booms have had the biggest busts, but
affordability has yet to be restored in many markets.


My best guess is that we are two years away from a bottom in RRE prices, and that prices will have to fall around 10-20% from here in order to restore more normal price levels versus rents, incomes, long term price trends, etc. Hey, it could be worse, Fitch is projecting a 25% decline.

Not all of the indicators that I put forth have to appear for there to be a market bottom. A preponderance of them appearing would make me consider the possibility, and that is not the case now. Some of my indicators are vague and require subjective judgment. But they’re better than nothing, and keep me in the game today. Avoiding the banks, homebuilders, and many related companies has helped my performance over the last three years. I hope that I— and you— can do well once the bottom nears. There will be bargains to be had in housing-related and financial stocks. [[But it is more than likely the weakest home builders will fold sometime this year.: normxxx]]

ß§

Normxxx    
______________

The contents of any third-party letters/reports above do not necessarily reflect the opinions or viewpoint of normxxx. They are provided for informational/educational purposes only.

The content of any message or post by normxxx anywhere on this site is not to be construed as constituting market or investment advice. Such is intended for educational purposes only. Individuals should always consult with their own advisors for specific investment advice.

Wednesday, April 8, 2009

Homes For The Holidays

Builders Are Still Home For The Brave
Homes For The Holidays
California 2009 Economic And Housing Forecast


By John Jannarone | 8 April 2009

Shares of home builders have enjoyed an extreme makeover. But has the paint on their balance sheets begun to peel? KB Home said Friday that orders for new houses rose for the first time since 2005 after it reduced prices and trimmed the size of its new houses. But prices are still falling, with no sign of an improvement. That is worrying, because the industry's cash flow is about to get chiseled away.

One problem is taxes. Loss-making companies can collect refunds on tax payments made over the previous two years. The pain of losses for many in 2007 and 2008 was cushioned by hundreds of millions in cash tax refunds.

KB, for example, will be able to enjoy a $220 million refund this year. Next year, it will be out of luck. Another home builder, D.R. Horton, expects to get a $677 million tax refund this fiscal year. It actually paid tax in 2007, so it will likely collect a smaller amount next year. But beyond that, there is nothing to recoup. D.R Horton has $1.5 billion of net debt.

Low sales volumes also make it hard to scrape together cash. New-home sales improved slightly in February to an annualized 337,000, but remain well below the 482,000 sold in 2008 and 768,000 in 2007. D.R. Horton may have some extra steam, given its specialty in the relatively strong market for lower-price homes. Unlike some peers, a decent portion of its $4.4 billion of land and housing inventory may become cash soon.

But until prices begin to rise again, investors who pick up home-building stocks should remember to wear hard hats.

.


Homes For The Holidays

By ContraryInvestor.com | 5 January 2009


Homes For The Holidays… Unfortunately, yeah, and plenty of ‘em. It’s an understatement to suggest residential real estate was either directly or tangentially very important to both economic and financial market outcomes in 2008. It has been the cornerstone of solvency, or lack thereof, in so many quarters of the financial sector [[and in so many quarters of the globe: normxxx]]. And as such, has had profound influence on the character of the US and really global credit cycle.

It’s been a while since we’ve checked in [but] all of us know that residential RE will continue to be a key macro economic health watch point as we move into the New Year. The current reconciliation cycle drag that is residential real estate, affects financial sector balance sheets, household balance sheets (and P&L's for that matter), etc. [It's] not about to [diminish] in importance to [the] macro economic outcomes in 2009.

You’ve seen what has happened recently as the Fed has gone into a good bit of hyper drive in terms of trying to financially engineer some type of stabilization in what continues to be a downhill journey for the asset class. They’ve allocated $600 billion to 'buy' the agency debt (Fannie and Freddie paper) in the hopes of getting and keeping US conventional mortgage rates down. And so far that has indeed happened as post the establishment of this [latest] Fed investment endeavor, conventional 30 year fixed mortgage rates dropped a good 100 basis points, plus or minus, in a matter of weeks. We’ll spare you the graph, but in recent weeks we’ve seen new mortgage applications and refi apps spike meaningfully higher.

Mission accomplished by the Fed? We’ll see, as we need to remember that a lot of folks with 'rate-locked, in-process loans' could only have taken advantage of these new lower mortgage rates by first canceling the prior loan, then writing a new one, probably with another mortgage vendor. This would naturally count as a "new" mortgage or refi app in recent data.

Hence, there may be a bit of anomalistically higher counts in recent weeks due specifically to getting around the prior 'rate lock' issue. We’ll need to continue watching the data in the months ahead. Lastly, as you may already know, China and a few foreign friends have been big sellers of government agency paper since the summer of this year. The $600 billion the Fed has already so generously provided is in part simply offsetting current foreign selling of US agency paper.

Additionally, the Fed followed up on the $600 billion down payment, if you will, in trying to spark housing price stabilization/reacceleration. They 'announced' that they would like to put a program together (through wonderful taxpayer sponsored Fannie and Freddie) to provide 4.5% 30 year conventional loans to new home buyers. After all, it is the season of giving, no?

Bottom line being, the Fed is starting to pull out all the stops to arrest home price contraction. Upping the ante in a big way relative to prior efforts. We expect the Obama regime to likewise address this issue, and perhaps [at least equally] forcefully. They’ve suggested rewriting existing mortgages, but that enters into the very dangerous and cornerstone area of contract law.

Key question for both our economic monitoring and investment decision-making ahead then becomes, can the US government decree/legislate/manipulate home prices higher, defying the natural laws of asset class supply and demand, as well as the character and path of a generational credit cycle now in reconciliation? Defy? We doubt it. Temporarily arrest? The correct answer is, we’re going to find out.

Important in that, as we all know, the locus of the initial US credit cycle trauma was the 'mortgage securities' markets. Residential real estate was also the locus of consumer credit creation this decade and a current key driver of household net worth [first of a huge increase and then the more recent] decline, certainly along with equities, influencing household financial well-being. Lastly, we need to remember the importance of investor psychology and bear markets as this applies to housing.

Even temporary stabilization in residential real estate would echo [throughout the economy, resulting] in positive psychological influence on the financial markets. All part of the ebb and flow of cycles in both financial markets and investor psychology. A few macro overview observations about just where we are in the cycle itself.

Cutting to the bottom line, at least in our minds, inventory and price remain the two largest outstanding fundamental issues for residential real estate, so far unresolved in this cycle. Once inventories get in line at least with historical precedent, and prices stabilize, then we can begin to anticipate a better tone to mortgage credit markets, the housing industry itself, consumer [feelings of] well being and, hopefully, the macro economy. It’s when housing stabilizes that the unprecedented stimulus being force fed into the system by the Fed/Treasury/Administration may begin to bite and gain traction.

Let’s get right to a few simple and self-explanatory views of life. The following is a four and one half decade view of median family home prices relative to median family income. To get back to the average level since 1963 for this ratio (the red line in the chart), median home prices would need to drop [merely] another 12% from current levels.


Of course this assumes the cyclical correction stops at the historical average. Let’s face it; we’ve already lived through a lot of price correction. The problem clearly is that other factors are currently weighing on residential real estate prices. Weak labor and wage growth, a coordinated global economic downturn of historical significance, and a credit market contraction of very meaningful magnitude is colliding with a housing reconciliation cycle. To argue that the above relationship will be arrested at the 'average' of the last four and one half decades [is probably] wishful thinking. [[This is especially so when we remember that the really low quality loans that helped drive housing prices upward in the last decade are probably no more— at least for another generation.: normxxx]]

Is the Fed essentially trying to speed up the reconciliatory process implied by the above relationship in manipulating the important plug factor in the real estate equation that is financing costs? Of course this is exactly what they are doing. Whether they will be successful is the unanswered question. And in good part that depends on the ability of inventory to clear as a result of the character of both price and financing costs.

Let’s move right on to the equally important issue of inventories. In the past we’ve shown you a lot of raw numbers when looking at this data. Time to stop that. Below is a look at the number of homes listed strictly as "for sale" properties (in other words this does not include second homes, rentals homes, etc.). This go around we compare these per unit of inventory for sale numbers to the total US population to get a better sense of historical perspective.

We’ve heard "everybody’s gotta live somewhere" a million times by those trying to bull up the residential real estate markets over prior years. And since the population is ever growing, comparing current nominal inventories to past cycles is misleading because of the dynamic of population growth. Oh yeah? Well now we’re looking at the number of homes for sale relative to "everybody". Any questions?


As the chart tells us, when looking at per unit for sale residential homes on what is essentially a per capita basis, we’re looking at a current level that is just shy of twice the historical average of the last four-plus decades. Yes indeed, everybody needs a place to live. It’s just a good thing there are so many places to choose from at the moment relative to historical precedent, no?

The last chart [illustrating] current residential real estate inventories very much mirrors the directional pattern of what you see above. It’s very simply the number of vacant single-family homes relative to all single-family homes. Bottom line? We’ve never seen anything like current levels. Residential real estate as an asset class cannot begin fundamentally to recover until inventory clears, and this is far from an "all clear" view of life. Seems a matter of relatively basic common sense, no?


House That Again? …Before concluding, a few last housing related anecdotes we hope are of interest. As per the comments above, we know that housing prices and current residential real estate inventories remain key, open question mark issues. And [of this] the home building industry is more than aware. This is a very good thing in terms of cycle reconciliation.

As of the latest data, housing starts rest near half century lows in nominal terms. Residential real estate construction has essentially collapsed. [[With, perhaps, a little assist from banks no longer extending credit to builders (but rather calling in loans when they can). : normxxx]] Existing inventories and price have been very strong drivers of this collapse in new activity. Years of demand [have been] more than satiated in the prior mortgage credit cycle.

The view of per unit starts is seen in the top clip of the following chart. In the bottom clip we look at starts as a percentage of the total US population. A new record historical low at recent levels. Clearly, existing inventory [[including the seemingly never ending wave of defaults/repossessions: normxxx]] remains the issue for real estate, not new inventory.

As existing inventory clears, the asset class will heal. That process is well underway. The Fed just wants to speed things up a little with a big bit of financial engineering. Of course financial engineering has worked so well for them in the past, right?


Finally a very simple update of macro US homeowner equity as a percentage of the [current] market value of real estate. You already know this ratio has been plunging for [several] decades now, plumbing new lows at an accelerating [pace] with each passing quarter over the last two to three years. The Fed has been kind enough to manipulate credit market mortgage costs downward, but only the real economy and real world residential real estate cycle can change the trajectory of what you see below. And this is key to credit market collateral values: a sense of household financial well being, [reasonable] access to real estate based consumer credit, etc. Important? Yeah, we'd say so.


As we look at the chart above and contemplate what may yet be to come, we come to the issue of deleveraging, coursing through the domestic and global economy. How must homeowners act in order to turn the trajectory of the relationship you see above upward in an otherwise very tough pricing environment? Deleveraging. Paying down mortgage debt. We're pretty convinced that financial sector deleveraging is well underway and has been more than discounted by the markets.

[On the other hand], we'd suggest that US household deleveraging is [barely] getting started in comparison and we believe has [still] a long way to run. We expect this will be a major macro theme for 2009. Have the markets completely discounted this thought? We're simply not sure at this point. Residential real estate was incredibly important to economic and financial market outcomes in 2008. We expect exactly the same in 2009.

The message of the data above is clear, price and inventory cycle reconciliation is not yet finished. What is also clear is that the Fed/Treasury/Administration are stepping up their efforts as we enter 2009, to truncate unfinished cycle reconciliation at almost all costs. Although we'll save this for a future discussion, we're not only focused on the importance of residential real estate in our current economic and financial market circumstances and how it will influence the financial sector, credit cycle dynamics and the real economy, but also place great weight on the [yet to be realized but sure to follow] unintended consequences of Fed/Treasury/Administration efforts to truncate the natural cycle.

The markets know what the Fed/Treasury/Administration are doing and are discounting these actions [and 'predictable' consequences] in financial market prices. But it's the "at almost all costs" 'unintended' consequences of this truncation attempt that may turn out to be most important to 2009 investment decision making.

.

California 2009 Economic And Housing Forecast:
Examining 5 Areas Showing California Will Have A Tougher Economic Year Than 2008.

Click here for a link to complete article:

By Dr. Housing Bubble | 2 January 2009

I won’t sugarcoat it for you. 2009 will be a much more difficult year for California than 2008. I am astonished that many pundits are now claiming how 2009 will be an up year for the markets even though the Dow Jones Industrial Average just faced a pounding unseen since 1931, during the Great Depression. They’ll point to examples like 1907 when the market fell 37 percent only to rebound by 46 percent in 1908. This is absurd since 1907 was much more isolated in terms of global reach.

And, in 1907, J.P. Morgan stepped in, putting up some of his own money to instill confidence. You tell me who is putting up their own money today? What we have is a bunch of beggars— mostly Wall Street and financial firms going to Washington for a piece of the bailout money parade— but no one seems eager to be left behind while Uncle Sap is dishing it out.

This time is significantly different. I have already given you 10 reasons why nationally this recession will be the worst since World War II. Those 10 reasons still stand as we enter the new year. Yet California will face pain on a more pronounced level because it has cast its lot with real estate and finance. The heart of the housing bubble darkness started here in sunny California.


Click Here, or on the image, to see a larger, undistorted image.


Remember epic toxic mortgage dealers like New Century Financial out in Irvine California? Or who could forget the ultimate toxic mortgage factory Countrywide Financial which has miraculously disappeared into the belly of the Bank of America beast? Or what about the fact that the median home price in California flirted with $600,000 for a month in 2007? These examples have all vanished. New Century Financial is gone and so is Countrywide. That $600,000 median price is now $285,680 IAW the California Association of Realtors data.

Many people, including those once skeptical, now think that we have reached bottom because things became so sour in 2008. They will be shocked this year. Why? Just because things have fallen so quickly is not a good reason that things will now go right back up. This seems to be the argument of most mainstream pundits who believe 2009 will be a better year.

They use an iteration of the argument that goes something like, "2008 was such a brutal year, and things are now so cheap, that it is time to go 'bottom fishing'." Total non-sense. If you look at the data what you see is continued weakness in the markets— possibly for some time yet. And California still has many other issues to confront.

What I will discuss today is the 2009 forecast for California in terms of the economy and housing. You can dig through the hundreds of articles here if you want to see how accurate some of my past analyses have been. [[I'll save you the trouble. He has been way ahead of the curve.: normxxx]] The first problem we still have is much of our employment is still closely tied to real estate. That has not much changed.

Consumer psychology is much more fragile now. That is, many people now, finally, believe that no, real estate does not go up forever. This is probably irretrievable damage to the outlook for a generation, which should keep another real estate bubble from forming anytime soon. Housing prices are still tanking and believe it or not, many metro areas in California are still wildly overpriced. Another reason is that the state budget (and that of any number of cities and local communities) is in shambles. Do you think it is good that we are staring at bankruptcy in 2 months? Plus, the toxic Pay Option ARM reset tsunami will be hitting with full force this year.

Reason #1— Employment

As you can imagine, I look at tons of data. The only way you can determine future movements in this market is to glance at and absorb many, many data points, reference similar historical economic events, and try to forecast where things will move— but not by the 'straight line projection' method favored by the stupid and lazy. You need to be cognizant of history, understand economics, and know how mass psychology affects consumer behavior. With that, let us first look at the California employment situation:


The unemployment rate in January of 2008 for California was 5.9 percent. The latest data we have is for November of 2008 and the current unemployment rate is at 8.4 percent. A 2.5 percent total increase in less than a year is amazing— that's more than a 40% increase in the number of unemployed! Without a doubt, the California unemployment rate will be well above 10 percent by the end of the year. Why? Well take a look at some of the latest layoff announcements being made: [[Note: these do not include those layoff announcements of the last two weeks in December: And, they have been accelerating in size and number! : normxxx]]


What you should immediately notice is this is well beyond a real estate and finance problem. Sure, the bulk of layoffs came from industries closely tied to these fields but the above list now tells you this is spreading to pretty much every industry you can imagine. Looking at the raw numbers of unemployed persons according to the BLS, it looks like California added 478,000 people in 2008 alone. Nationwide 1.911 million people were added to the unemployment statistics. What this means is California was 25 percent of all unemployment net-additions.

What you then need to do is look at which industries employ the most Californians:


The layoff announcements should tell you that practically every area is feeling the crisis. The above chart should give you a snapshot of how the employment picture pans out. I’ve highlighted areas that will be most directly impacted by this crisis. This does not mean other areas will not also suffer, but only that these areas will feel the pain most immediately and most significantly.

Together with the sales and food related fields, these are the lower paying industries. Many of these workers will have a tough time finding other work, should they be laid off. California’s unemployment insurance is reaching the breaking point. Construction will face pain as well. Who is building any large projects right now?

Reasons #2— DRE Licensees And Consumer Psychology


Click Here, or on the image, to see a larger, undistorted image.


For most of the 1990s, there were approximately 300,000 real estate licensees in the state active at any one time. We are currently at 535,000+ active licensees. What does this mean? People are still delusional regarding real estate. (I should point out that many DRE licenses last a few years so you may be seeing people still active on the rolls yet not likely to be renewing anytime soon.) Forecasting means looking at the future and we can already see that the real estate psychology is broken:


The above is stunning. In September of 2007 14,918 salesperson exams were administered. In September of 2008 only 1,590 exams were given! In October of 2008 only 1,480 were administered. Game over.

What this tells us is the allure of real estate has been broken. The once glamorous lifestyle portrayed on housing porn shows is now rapidly evaporating. Keep in mind this was another revenue (although tiny) stream of income into the state which will now be gone. How many people will stop renewing their licenses?

Reason #3— Case-Shiller Housing Prices


Click Here, or on the image, to see a larger, undistorted image.


I want to spend sometime on this chart. I have constructed the above chart using the Case Shiller Index data for 3 largely followed metro areas in California. The data up until October 2008 is from the actual data set. I’ve also included the 'futures' data which is traded on the CME.

When I tell you that California will not hit a housing bottom until 2011, I am not the only one who believes this. These contracts are backed by fairly sharp money people not accustomed to losing. If you believe otherwise, go ahead and bet against them with your own money. Let us see how many pundits put up some serious cash here to back up their rosy predictions.

The principal thing that should come to your attention is all 3 major areas have further to fall. Los Angeles and San Diego have the biggest drops ahead, according to the futures data. Yet what should jump out at you as well is how the market will essentially stagnate well into 2013. The contracts for 2012 and 2013 are little traded but you already have people betting for a stagnant market for another 4 years. I tend to agree with them.

There is very little evidence to show us that somehow prices will be rebounding anytime soon. Short of skyrocketing wages and solid employment, why are we to believe the market will do well in 2009?

Reason #4— California Budget


How can anyone listen to politicians tell us we are weeks away from a statewide bankruptcy and, then, in almost the same sentence, say things will be better in the state for 2009? Look at the chart on the left. I have used this chart numerous times because it highlights the magnitude of the problem.

The two largest sources of revenue for the state are personal income tax and sales tax. With unemployment rising (see above) and personal spending falling, that means less personal income tax and sales tax. With property prices tanking, this is another revenue source which will be shattered.

Also, California is home to many millionaires and billionaires, the most of any state in the country. Many of these people have money in the stock market. When they go to do their taxes, guess what is going to happen. We just had the worst stock market since the Great Depression. You can rest assured that many of these people are going to claim large losses, meaning they will pay substantially less in state income taxes than in 2008.

There is only two ways to fix this problem. Raise taxes or cut the state payrioll. Both are bad yet that is what is left. Cutting jobs only adds to the unemployment lines and raising taxes in a bad economy is a further drag on business. Our current group of politicians has no backbone. Do some of both and get on with it. Yet be a bit more strategic about it. Don’t be idiotic like our federal government that is bailing out crony capitalism and is throwing trillions of dollars into an abyss.

Unfortunately, we are broke both as a state and at a federal level. Where will the money come from? The California budget is well over $100 billion so this isn’t going to be solved by telling people to stop using staplers.

Reason #5— Pay Option Arms

The final nail in the coffin is the number of pay option ARMs that will reset in the state in 2009. These incredibly toxic loans are going to reset at the worst possible time. I’ve seen a few argue that lower rates will help yet this is another misconception: lower market rates will do nothing for the pay option ARMs of California. And for the purposes of pay option ARMs, over 50 percent of the nominal value of these mortgages outstanding rest here in California.

Why is this problematic? As we pointed out above, the median home price in California has fallen roughly 50 percent from its peak. Many of the option ARMs have little equity from home buyers. That is, little of the homeowner's 'skin' was put into the game. Now that prices have tanked, many borrowers are running the numbers and are gearing up for a 'moonwalk' away from their mortgage in 2009.

You can ignore the drop in foreclosures towards the end of the year. This was because of SB 1137 and the Fannie Mae and Freddie Mac moratorium. Guess what? Holidays are now over and now back to reality. These pathetic measures were the equivalent of an ostrich sticking its head into the sand.

In addition, you cannot refinance an underwater mortgage! And, the vast majority of these California loans are so underwater, they are swimming in Jacque Cousteau territory. These loans never served any purpose except to delude prospective homeowners and garner all of those lenders' middlemen outrageous fees. We can only hope that with new federal regulations, we will have an outright ban on them.

Those are 5 reasons why California will have a challenging 2009. There are many other reasons as well, but these should suffice for now, since the year is young. Buckle up because it is going to be bumpy ride folks.

  M O R E. . .

Normxxx    
______________

The contents of any third-party letters/reports above do not necessarily reflect the opinions or viewpoint of normxxx. They are provided for informational/educational purposes only.

The content of any message or post by normxxx anywhere on this site is not to be construed as constituting market or investment advice. Such is intended for educational purposes only. Individuals should always consult with their own advisors for specific investment advice.


ß§

Normxxx    
______________

The contents of any third-party letters/reports above do not necessarily reflect the opinions or viewpoint of normxxx. They are provided for informational/educational purposes only.

The content of any message or post by normxxx anywhere on this site is not to be construed as constituting market or investment advice. Such is intended for educational purposes only. Individuals should always consult with their own advisors for specific investment advice.

Tuesday, April 7, 2009

On The Inflation Front

What’s Happening On The Inflation Front?

By Steve Saville, sas888_hk@yahoo.com | 7 April 2009

Here are excerpts from commentaries recently posted at Speculative Investor on 5th April 2009.

Current Situation

The Fed scaled back its money-pumping efforts over the first three months of this year, which is not surprising given that it would have been almost impossible to sustain the frenetic pace achieved during the final four months of last year. But even though the Fed's actions have become less frenzied of late, the Fed-Treasury tag team has made sure that the rate at which new money is borrowed into existence continues to exceed, by a substantial margin, the rate at which money is extinguished via debt repayment. This has mostly been accomplished via the US Government increasing its debt load at a much faster pace than the private sector de-leverages. As mentioned in previous TSI commentaries, the private-sector debt bubble is in the process of being replaced by a public-sector debt bubble.

The following chart shows the year-over-year percentage change in True Money Supply (TMS). Note that TMS does not include bank reserves. When the banks eventually start lending their excess reserves the result will be a further increase in TMS, but there is no telling when that will happen. It could, for example, happen within the next few months, but on the other hand the commercial banks could decide to sit on their excess reserves for several years. Either way there is likely to be a lot more monetary inflation over the coming 12 months for the same reason there has been a lot of monetary inflation over the past 12 months: increased government borrowing and Fed monetisation of both government and private debt.


Click Here, or on the image, to see a larger, undistorted image.


On the above TMS chart we have identified three separate periods. Period A (mid-2001 through to mid-2004) had fast money-supply growth, Period B (early-2005 through to early-2008) had slow money-supply growth, and Period C, which began during the final quarter of 2008, has thus far been characterised by fast money-supply growth. The fast money-supply growth of Period A fueled rapid price rises in houses, housing-related debt securities and commodities, and the slow money-supply growth of Period B led to large price declines in houses, housing-related debt securities and (eventually) commodities. The fast money-supply growth of Period C WILL fuel rapid price rises SOMEWHERE in the economy.

There is nothing novel or complicated about the theory that fast money-supply growth over a prolonged period leads to substantial price rises and that a subsequent sharp slowing in the pace of money-supply growth causes prices to retrace; it is just basic supply and demand. However, the effects of monetary inflation are non-uniform and the time delays are both lengthy and variable. The challenge, therefore, lies in determining which prices will be affected the most by the money-supply changes and how much time will elapse before the effects of the money-supply changes become evident in prices. This is not only a challenge for investors; it's also a challenge for policymakers.

One of the main problems faced by policymakers (central banks and governments) in their efforts to manipulate the economy to their own best advantage is that they will always be able to inflate the money supply but they will never be able to control the effects of the inflation [[except by inducing another recession, ala, Paul Volcker: normxxx]]. Sometimes they will get lucky and the right things (stocks and real estate, for instance) will be the primary beneficiaries of the inflation, but at other times they will be unlucky and the wrong things (gold and oil, for instance) will gain the most ground in response to the inflation. We suspect that over the next few years they will be as unlucky as they can be in that gold and oil will be by far the biggest winners.

Will The Fed Eventually 'Soak Up' The Excess Money?

Bernanke and his Fed cohorts will naturally say that they plan to remove much of the recently injected money once the economy recovers. In all likelihood they will also go as far as making preparations to drain away the "excess liquidity"; for example, getting approval for the Fed to issue its own bonds. This is all part of managing inflation expectations. However, there is almost no chance that the Fed will actually engineer a significant slowing in the rate of money-supply growth until it is way too late (until a major inflation problem is 'baked into the cake').

The reason is that the inflationary policies implemented to date will not only fail to turn the economy around, they will very likely make things worse. To put it another way: the harder they try to stimulate the economy by creating money out of nothing the more economic damage they will do (counterfeiting money transfers wealth from productive enterprises to the counterfeiter [[and those benefitting thereby: normxxx]] and thus reduces the economy's growth potential) and the longer it will take for a sustainable economic turnaround to begin.

Rather than draining away the so-called "excess liquidity" that was injected in an effort to boost the economy, it is more likely that the obvious failure of Fed-sponsored inflation and increased government spending will lead to even more of the same. After all, every good doctor knows that if a patient becomes sicker after taking a certain medicine then the correct response is to double the dosage. And if that doesn't work, double it again.

The Cost Of "Flexible" Money

One of the most popular arguments against having gold as money is that a gold-based monetary system would be inflexible, the implication being that today's dynamic economy requires a more flexible, or elastic, form of money. Well, if by "inflexible" it is meant that under a gold-based monetary system the supply of money could not be arbitrarily expanded by governments and banks, then yes, a gold-based monetary system would be inflexible, but such inflexibility is a consummation devoutly to be wished. In our opinion the ideal money would be as constant as the sun, enabling each of us to calculate exactly how much money we needed to save to cover our future living expenses. [[That is, assuming we survived the periodic deflationary depressions such as occurred up until 1933. : normxxx]]

Today's official money is very flexible, and it's not hard to see the cost of this flexibility. The chart at left from Grandfather Economic Report series reveals one method of quantifying this cost. The chart shows that the total quantity of debt in the US economy was around 185% of net national income in 1957 and was still around this level at the beginning of the 1970s. However, by 2008 the total debt had grown to about 500% of net national income. Bear in mind that the current wholly "flexible" monetary system came into being in the early-1970s [[we went off the domestic gold standard in 1933: normxxx]]. In other words, the introduction of wholly "flexible" money led to a veritable explosion in the quantity of debt.

Steve Saville

ß§

Normxxx    
______________

The contents of any third-party letters/reports above do not necessarily reflect the opinions or viewpoint of normxxx. They are provided for informational/educational purposes only.

The content of any message or post by normxxx anywhere on this site is not to be construed as constituting market or investment advice. Such is intended for educational purposes only. Individuals should always consult with their own advisors for specific investment advice.

Fighting Recklessness With Recklessness

Fighting Recklessness With Recklessness
Click here for a link to complete article:

By John P. Hussman, Ph.D. | 7 April 2009

All Rights Reserved And Actively Enforced.
Reprint Policy

************

With regard to the economy, there is quite a bit of optimism that the recent market advance represents a forward-looking call that the economy will recover in the second half of the year. Indeed, some analysts have noted that year-over-year consumer spending has only declined very slightly, hailing this as evidence that economic concerns are overblown. The difficulty is that consumer spending has never declined on a year-over-year basis, except in this downturn, so that that slight decline is actually the worst showing for consumer spending in the available data. Likewise, capacity utilization has plunged to levels seen only in 1974 and 1982, both which were accompanied by far deeper valuation extremes than at present.

I recognize that given the depth of the recent decline, it seems as if stocks must be at once-in-a-lifetime valuations. Unfortunately, this is an artifact of the previous level of overvaluation. The depth of a bear market often has a loose relationship with the extent of the prior bull market (and particularly with the level of valuation of the prior bull), but there is very little relationship between the depth of a bear market and the subsequent bull.

If we assume that the long-term fundamentals of the economy have not been affected in any meaningful way by this economic downturn [[fat chance! : normxxx]], then stocks are most likely priced to deliver long-term returns between 9-11% annually over the coming decade, with outlier possibilities of as much as 14% if the market ends the coming decade at historically overvalued levels, and as little as 4% if the market ends the coming decade at historically undervalued levels. Far from being once-in-a-lifetime values, prospective 10-year returns on the S&P 500 are not far from their historical norms here. Stocks are about fairly valued.

The only way that stocks could be considered extremely undervalued here is if we assume that the record profit margins of 2007 (based on record corporate leverage) are the norm, and will be quickly recovered. While we never rule out the potential for surprising strength or weakness in the markets or the economy, the assumption that profit margins will permanently recover to 2007 levels is equivalent to assuming that the past 18 months simply did not happen.

Still, given sufficient evidence of broad improvement in market action (which we take as a measure of risk tolerance and economic expectations), we wouldn't fight the combination of roughly fair values and a willingness of investors to bear risk. We've been carrying small "contingent" call option positions for a good portion of the recent advance. This helped to compensate for our low weightings in financials, homebuilders and other low-quality sectors that have enjoyed frantic short-covering. Still, with only about 1% of assets currently in those calls, our stance is still characterized as defensive here, as we are otherwise fully hedged. Again, we won't fight a broad improvement if it continues sufficiently, but if I were to make a guess, it would be that the potential downside in the S&P 500 from these levels could approach 30-40%. That is not a typo, and it is not a possibility that should be ruled out.

I have no idea how long investors will remain enthusiastic about trillion dollar band-aids and erosion of the integrity of our accounting rules. I do know that at the end of the day, what matters is the long-term stream of deliverable cash flows that investors can actually expect to reach their hands. It's exactly that consideration that makes it clear that we will sink deeper into this crisis until we observe debt restructuring on a large scale. If we don't restructure the debt, the debt will fail, because for many borrowers, the cash flows aren't there, and it is not possible to service the debt on existing terms.

Market Climate

As of last week, the Market Climate for stocks was characterized by fair valuations (modestly but not significantly undervalued on measures based on prior earnings, still overvalued on measures that do not rely on a reversion to above-average profit margins in the future). Market action is demonstrating some favorable signs, particularly evident in breadth-based measures such as advancing versus declining issues, and we are willing to carry some call option exposure on that basis, but the overall price-volume behavior still appears more consistent with a standard bear market rally punctuated by periodic short-squeezes. Suffice it to say that we've got some amount of exposure to further market strength, but that we are skeptical that the recent advance has important information content about a pending economic recovery. So far, it looks very much like the interim advances often observed during periods of ongoing market weakness.

In bonds, the Market Climate last week was characterized by moderately unfavorable yield levels and relatively neutral yield pressures. The Strategic Total Return Fund continues to have the majority of its assets in medium term Treasury Inflation Protected Securities, with about 25% of assets allocated across precious metals shares, foreign currencies, and utility shares. I continue to believe that it is too early to purchase distressed corporate debt— the view that this sector is a bargain is predicated on the belief that the economy has worked its way through this deleveraging cycle and is ready to rebound in the months ahead.

Interestingly, though there is a lot of chatter in the stock market about the hope for improving economic conditions, it seems that the bond market didn't get the memo. Credit spreads have moved sideways or have even widened in recent weeks, including corporate-corporate spreads like AAA versus Baa. Many credit default swaps actually blew to new highs last week, though the additional jump the day before the FASB announcement seemed to me to be a speculative pop on the possibility that the FASB would leave mark-to-market alone. In any event, the non-uniform features of the recent advance don't appear particularly healthy. One gets a stronger signal about investors' risk preferences when a stock market advance is coupled by broad sector leadership (not just battered junk stocks), narrowing credit spreads, and a wide range of other elements of market action.


  M O R E. . .


Normxxx    
______________

The contents of any third-party letters/reports above do not necessarily reflect the opinions or viewpoint of normxxx. They are provided for informational/educational purposes only.

The content of any message or post by normxxx anywhere on this site is not to be construed as constituting market or investment advice. Such is intended for educational purposes only. Individuals should always consult with their own advisors for specific investment advice.

Thursday, April 2, 2009

Puncturing Deflation Myths

Puncturing Deflation Myths, Part 1
Inflation During The Great Depression

Puncturing Deflation Myths, Part 2
False Lessons From Japan

By Daniel R. Amerman, CFA, Inflationintowealth.Com | 21 March 2009

Overview, Part 1

As the financial crisis continues to deepen, many people are deeply concerned that collapsing credit availability will lead to powerful monetary deflation, much like it did during the US Great Depression of the 1930s. As compelling as these arguments seem to be— are they backed up by the actual historical evidence? In this article we will:

1) Ask a crucial real world question about deflation theories;

2) Revisit the US Great Depression with a focus on 1933 rather than 1929;

3) Show that the central monetary lesson of the US Depression is not the unstoppable power of deflation, but rather, the historical proof of how a sufficiently determined government can smash monetary deflation and replace it with inflation— at will and almost instantly, even in the midst of a depression;

4) Examine two historical and logical fallacies that lead to the mistaken (albeit widespread) belief that the Depression proves the modern deflationary case, when it in fact proves the opposite; and

5) Briefly discuss the third logical fallacy that threatens many investors’ standards of living over the years to come, particularly those who are retired or investing for retirement.

A Simple But Vital Question

I received a letter from "GW", an economically astute and well read person who had attended one of my inflation solutions workshops. GW said that I had made the most compelling case for inflation he had ever heard, but that he remained troubled. There were a lot of deflationists out there, and there were some highly intelligent and credentialed people who were making some powerful theoretical arguments for deflation. GW asked: would I be willing to debate some of those arguments with him?

I replied that I would, but I would only debate theory if he could first answer a simple, real world question. "Name an example of a modern, major nation where the domestic purchasing power (as measured by CPI) of its purely symbolic & independent currency uncontrollably grew in value at a rapid rate over a sustained period, despite the best efforts of the nation to stop this rapid deflation?"

GW thought he had two answers— the usual two of the United States during the Great Depression, and modern Japan. Understanding why neither of those answers is correct is the subject of this and the following article. This article, Part 1, will be devoted to uncovering some lessons from the US Great Depression that will surprise many readers, while Part 2 will separate truth from fiction regarding Japan’s deflationary struggles, even as it separates asset deflation from price deflation.

Please carefully note the bolded and italicized words in the central question above. They are essential. Consumer price deflation has a long and sometimes infamous history, as we will discuss below. However, a specific argument being made by many observers is that the United States (and other major modern economic powers) run the risk of falling into a powerful deflationary trap as the availability of credit collapses, the volume and velocity of money shrinks, and this combination will then lead to major and rapid monetary and price deflation that the government will be powerless to stop. On paper— some powerful theoretical arguments appear to exist to support this assertion.

However, before millions of investors shift their portfolios to protect themselves from 'unstoppable' deflation, or neglect to protect themselves from inflation because they do not know whether the future holds inflation or deflation— isn’t it worthwhile to first demand that proof be provided of at least one fully relevant real world case study where this actually happened? Simply stated:

Where’s The Beef?

What is the specific example of a modern, major economic power proving powerless to stop the rapid rise in the domestic purchasing power of its own independent currency, as measured by the CPI?

And if such a deflationary example cannot be produced and defended— but we do have a very long and repeated history of inflation across nearly all modern nations with modern currencies— is this not the single most important data point that individuals should consider in weighing the relative risks of monetary deflation versus inflation?

The Great Depression: A Succinct Statistical Summary

The Dow Jones Industrial Average reached a peak of 381 on September 3, 1929. By July 8, 1932, it had reached its floor of 41, a plunge of 89% in less than 3 years. (This is a historical tidbit that those who think they are "bottom fishing" at current stock market levels should keep in mind.) The United States Gross Domestic Product was $103 billion in 1929. By 1933 it had fallen to $56 billion, a decline of 46%.

Accompanying the freefall in both the economy and the markets, price levels were falling as well— meaning that the value of a dollar was rising rapidly. The Consumer Price Index was at a level of 17.3 in September of 1929, and by March of 1933 had fallen to a level of 12.6. This means that what cost $1.00 in 1929, cost 73 cents (on average) by 1933. This 27% deflation, this fall in the average cost of goods and services, represents a 37% increase in the purchasing power of a dollar.

For some people, the effect of this deflation was to increase both their wealth and their standard of living. These are the people who had substantial money savings, either in physical cash, or fixed denomination financial assets that survived the economic turmoil, such as accounts in banks that did not go bust, or the bonds of companies that did not default. For these individuals, all else being equal, their standards of living rose because they had the same amount of dollars, and each dollar bought more than it had previously.

However, this increase in the value of a dollar was achieved at great cost for most of the nation (and the world). The reason for the increase in value was that dollars had become scarcer for businesses and most individuals. The destruction of the banks and much of the financial markets had dried up access to money on attractive terms. Widespread unemployment meant fewer dollars available to buy goods and services, which drove down the prices, which is what dropped the Consumer Price Index.

Most importantly, the deflation was not independent of the plunge in the markets and economy, and not just as a result, but most economists agree that this monetary deflation was actually a reason why the Great Depression got as bad as it did. Because there was not enough money, the source of funding for growing businesses was gone. Because there was not enough money, and the money outstanding had grown too dear, consumers were not spending.

Because there wasn’t enough spending, businesses had to lay people off. Which further reduced consumer spending. The nation was caught in a vicious deflationary cycle, which it seemingly could not break out of.


Yet, the United States did break out of the deflationary cycle, as illustrated in the graph above. After rapidly plunging for about 30 months, with the CPI seemingly in free fall and not able to find a floor— there was an abrupt turnaround. Not only was a floor found, but an immediate cycle of inflation replaced the seemingly unstoppable deflation. The nation turned essentially "on a dime", from unstoppable deflation to inflation instead. A cycle of inflation that has continued until this day.

What Happened? March 9, 1933

President Franklin D. Roosevelt was inaugurated on March 4, 1933. He came into office with a mandate and agenda to stop the Depression, and that meant breaking the back of the deflationary spiral. His actions were swift, beginning with a mandatory four day bank holiday imposed the day after his inauguration.

Five days after Roosevelt took office, on March 9th, the Emergency Banking Relief Act was passed by Congress. This was the first in a series of executive orders and bills that would take place over the following weeks and year. These actions would cumulatively take the United States government off the gold standard— and would also effectively confiscate all investment gold from US citizens at a 41% mandatory discount.

From 1900 to 1933, the US government had been on a gold standard, and had issued gold certificates. In a matter of days, in March of 1933, there would be a radical change. A veritable 180 degree turn that would not only repeal the gold standard, but effectively make the use of gold as money illegal in the United States.

Fallacy One: Confusing Apples & Oranges

There is a common simplification that people make when they look at money over time. They think that a dollar is a dollar, even if the purchasing power has changed a bit. This is a quite understandable mistake, particularly if your profession does not involve the study of money. When we look back over history— nothing could be further from the truth.

This assumption instead reflects an elementary logical error, that may be quite dangerous for your personal future standard of living, if it leads to your drawing the wrong conclusions. The term "dollar" is only a name (the same holds true for the "pound", "franc", "peso", "mark", and all other currencies). What matters is not the name, but the set of rules— or collateral— that back the value of the currency, during a particular historical period.

When we look back over long-term history, then sometimes it is gold, sometimes it is silver, sometimes it is both, and sometimes it is something else altogether. (As a creature of politics, "money" has always been of a complex and quite variable nature, given enough time.) So when we say history "proves" something about a currency, we need to be very, very careful that we are talking apples and apples, rather than apples and oranges.

For instance, when we look at precious metals backed currencies, the deflation of 1929 to 1933 when the US was on the gold standard was nothing new. It was just the latest development in the ongoing cycle of inflation and deflation that characterizes this type of currency. Indeed, there were four major deflations during the century before Roosevelt ended the domestic gold standard, and the deflations of 1839-1843 and 1869-1896 were each much larger than the deflation of 1929-1933, with the dollar deflating roughly 40% in each of those earlier major deflations.

This deflationary history does not, however, reflect the value of the "dollar" (as we currently know it) bouncing up and down, but rather the value of the tangible assets securing the dollar bouncing up and down around a long term average. Going off the gold standard was nothing new either. Many nations have gone through periods, particularly during wars, when more money is needed than there is gold or silver to back it up.

So, they issued 'symbolic' (fiat) currencies that were backed only by the authority of the government, or debased the metals content of the coins. These fiat currencies almost always turned out badly. Instead of cycling up and down in value over time, they tended to go straight down and never come back up. [[But herein also lies a story, because when the value of the Weimar Mark essentially fell to zero, what replaced it? Why, just another type of Mark, an ArbeitsMark, also without any gold or silver backing, backed only by the "labor" of the German people. Nevertheless, it was accepted at par and did not suffer the fate of the Weimar Mark until the end of the Third Reich.: normxxx]]

While global monetary history is complex and long, it is highly, highly unusual for a symbolic currency to experience major and sustained deflation at the levels that are the norm with precious metals backed currencies. It is this quite understandable but wrong belief that a "dollar" is a "dollar" that creates the ironic situation of many millions of people believing that the deflation of the US Great Depression proves the case for deflationary dangers in the current crisis. Not at all— what we have instead is the elemental logical fallacy of mixing up apples and oranges.

Yes, the US experienced powerful monetary and price deflation during the early years of the Great Depression, but that was with a dollar that was backed by gold. A currency in other words, that has almost nothing to do with today’s dollar, other than the name. A currency type whose long term history is radically different than fiat currencies— such as the dollar today.

Fallacy Two: Reversing The Historical Lesson

Let’s revisit the sequence of events and what actually happened. The United States was stuck in a powerful deflationary spiral with a gold-backed currency, that seemed unstoppable. A currency that had little to do with what we call the dollar today, other than sharing the name.

So, the government changed the rules, and replaced the old dollar with a new dollar, whose value was not based on gold. A dollar much like we have today (albeit not quite the same as there was still a gold backing on an international basis). And what happened?

In the depths of depression, at the height of a deflationary spiral, the government successfully broke the back of deflation within one week. In the midst of deflationary pressures far greater than we are seeing today, the government not only stopped the deflation, but replaced it with inflation. Indeed, by May of 1933, only two months after the currency rules changed, the monthly rate of inflation hit an annualized rate of 10%, and even hit a 40%+ plus (annualized) monthly rate by June of 1933. [[FDR's original "brain trust" foolishly thought that if they broke the back of monetary deflation, the depression would end. It was not to be.: normxxx]]


If you’re concerned about a new US depression leading to unstoppable price or monetary deflation because of what happened in the 1930s, let me suggest that you study and remember the graph above. When you get worried about monetary deflation— take another look at March of 1933. Remember as well, the one near universal lesson from the long and convoluted history of money: every time the rules governing a currency lead to a problem that causes too much pain for a government to bear— the government just changes the rules.

The bigger the problem— the bigger the rules change [[hence, TEOTWAWKI*: normxxx]] (and the bigger the wealth redistribution). So, when we look not at near irrelevant gold certificates, but at the dollar we have today, what the Great Depression of the 20th century in the United States historically proves is not the unstoppable power of deflation, but the opposite: that a sufficiently determined government can smash monetary deflation at will, virtually instantly, even in the midst of depression, and replace it with monetary inflation.

In the process of breaking the back of deflation (in 1933)— the nature of the dollar itself fundamentally changed. Throughout the 19th century and the first 30 years of the 20th century, the value of the dollar fluctuated up and down, as the (usually) gold-backed currency experienced regular cycles of both inflation and deflation. This cycle was replaced entirely by a new pattern— which could be characterized as down, down, down, as illustrated in the graph below.


(The graph above may look like it starts at 95 cents, but it doesn’t, it starts at $1.00. The fall in the value of the dollar in 1933 once the gold standard was abandoned was so fast it can’t be seen with a 75 year scale and monthly increments.)

A 76 year old person born in the 19th or 18th centuries would have seen the value of his or her currency fluctuate up and down over their lifetimes, and there was a pretty good chance that at age 76, the dollar (or pound) would have been worth the same or even more than it was when they were born. When the US Government fundamentally changed the nature of "money" in 1933, it created an entirely different pattern— all down, and no up, so that for a 76 year old person today, a dollar will only buy what 6 cents did at the time they were born.

As we try to decide whether the danger ahead is inflation or deflation today, what is the monetary lesson for us from the US Great Depression? The common belief is to say the Great Depression proves the awesome power of deflation, that the government can have a great deal of difficulty in fighting it, and may not be able to fight it at all. This is an extraordinary misunderstanding, and constitutes the second of our logical and historical fallacies.

What the Great Depression showed was that if you have a tangible asset backed currency, such as by gold or silver, and you enter a depression, then history has shown time and again that you're likely to have a period of substantial monetary deflation. However what March of 1933 showed us, is that even in the midst of a terrific burst of asset deflation, even in the midst of a terrible depression, if you take away the tangible assets that back your currency and you introduce a purely 'symbolic' currency, then the force of inflation that is associated with a purely symbolic currency (as well as the changes in monetary policy that are thereby enabled) can be so powerful that it overcomes the depressionary economic pressures and forces monetary inflation. [[The value of money has little to do with its 'backing' and much to do with its scarcity. Money backed by gold or silver is limited in quantity, and so its value cannot decrease greatly, as that would mean either that the value of the backing was diminishing or that the amount of backing per dollar had been reduced. In effect, the backing acts as a sort of discipline which prevents the wholesale, uncontrolled 'production' of dollars.: normxxx]]

Indeed what March of 1933 showed is that the value of money can turn on a dime when we are using a symbolic currency [[whose value can be regulated simply by increasing or decreasing the amount of dollars in circulation.: normxxx]]. We thus have absolute proof that even in the middle of a depression, the government has the power to stop a deflationary spiral at will. We know, further, that this deflation fighting strategy was not a one time anomaly, but was so successful that it broke the historical cycle of inflation/ deflation , and led to a 94% destruction of the value of the dollar over the next 76 years. [[But, on the other hand, the benefit has been that we have escaped severe depressions and asset deflations and only retirees have suffered, since wages and assets have more or less kept even with the money inflation, until now.: normxxx]]

It is a great irony that this lesson is so widely misunderstood. Unfortunately, this misunderstanding is highly dangerous for investors, as it leads them to worry about what is likely not a problem, instead of concentrating on the grave dangers illustrated by this same historical example. Dangers that involve the simultaneous combination of asset deflation (the destruction of the purchasing power of your assets) and monetary or price inflation (the destruction of the purchasing power of your money). As I have written about in other articles and books, these are a potent wealth destroying combination with a long history of destroying wealth in general— and retiree wealth in particular— in societies that are in economic distress.

Some People Understand What Happened Very Well Indeed

While misunderstanding what happened in the Great Depression is common, it is not at all universal, particularly among economists. Indeed, what really happened during that period between 1929 and 1933 has been a career-long source of fascination for one important economist in particular: Ben Bernanke, Chairman of the Federal Reserve. Bernanke believes that a major mistake was made— and it wasn’t abandoning the gold standard.

No, Bernanke’s quite public belief is that the economic contraction that was the Depression was much deeper and longer than it needed to be, and the reason was that monetary stimulus was too small and too late in coming. In other words, his belief is that if the rules governing the nature of the US dollar had only been changed earlier, so that there was inflation instead of deflation by 1930 or 1931, the economic devastation inflicted on the nation by the deflationary spiral would have been much less. (Some economists look to the example of Japan abandoning the gold standard in 1931, two years earlier than the US, and the shallower and shorter economic contraction that was experienced there.)

Bernanke got his nickname of "Helicopter Ben" from a flippant comment he made, in which he dismissed deflationary fears with a joke about dropping money from a helicopter if needed. This is a very important joke, with drastic implications for your personal net worth. Instead of fearing deflation, Bernanke finds fears about deflation to be humorous because he understands the principles described in this article very, very well indeed, and has for many years.

There are no immutable and awesome powers of monetary deflation that render governments helpless. Because once it is freed of its connections to precious metals or other currencies— money is really just a symbol with an inherent value of zero. [[But so is gold; what good is gold in the middle of a desert, you can't eat, drink, or shelter with it! But gold is scarce (and ornamental); hence its value. And, as Paul Volcker proved, when paper money is made scarce, it too will appreciate in value or, at least, nip inflationary tendencies in the bud.: normxxx]] What gives a national currency value are the rules that are set up by the government. And if the rules become inconvenient, well, what’s the point in being in power, if you can’t change the rules when you need to?

Changing the rules is not a theory about what Bernanke might do. It is a description of what he has already been doing on a massive scale. The self-imposed shackles that used to restrain past Fed chairmen are already history. The Fed is creating money at a rate never seen before, trillions of dollars a month, effectively out of thin air.

The Fed typically doesn’t do this, because, of course, such actions rapidly destroy the value of the currency. But if the person in charge of the money supply understands that destroying the value of the currency is how you prevent deflationary spirals from getting started— and believes massive and fast government intervention is the best way to stop an incipient depression before it gets any worse— then much of what the Fed has been doing recently becomes much more understandable.

The Third & Most Dangerous Fallacy

Our first fallacy was the widespread belief that the Deflation of 1929 to 1933 proved that major deflation is a major risk for a nation in depression. What it actually proved was that deflationary spirals are a major risk for gold-backed currencies, even while providing concrete historical evidence that symbolic currencies which are backed by nothing but government policies (such as the dollar today) can be forced into inflation even in the very middle of a severe depression.

Our second fallacy was believing that price deflation can grow so powerful that it can render a country’s monetary policy almost helpless to fight it. But what March of 1933 showed is that a sufficiently determined government can break the back of monetary deflation at will and almost instantly, simply through changing the rules that govern the value of that currency. (The far more dangerous problem of asset deflation is a quite different matter, as we will explore in Part 2.)

There is a third fallacy which is perhaps the most important, and that is the belief that inflation or deflation changes wealth for the nation as a whole and there's nothing that you personally can do much about it. This belief that we are all in the some boat together is perhaps the most dangerous mistake of all for individuals seeking to protect their wealth. Inflation and deflation do have an impact on the real wealth of society, they do affect the creation of real goods and services, and impact the real GDP, but they also do something else that is every bit as powerful, that is even more immediate and that is deeply personal. What inflation and deflation do is that they redistribute the rights to wealth within our society.

When we look back to the Great Depression in the years 1929 to 1933 then, for retirees at that time who did not have their savings in the market or in banks that went bust, those were actually good years for them financially, particularly relative to the rest of the population. Monetary deflation redistributes wealth from society at large to many retirees. However, sustained, major monetary deflation with a symbolic currency is quite rare, and hasn’t happened in modern times.

This brings us back to that central question regarding the case for deflation: "where’s the beef?" Where is that example of "a modern, major nation where the domestic purchasing power (as measured by CPI) of its purely symbolic & independent currency uncontrollably grew in value at a rapid rate over a sustained period, despite the best efforts of the nation to stop this rapid deflation?" If actual history is what matters to you rather than theoretical discussions, unfortunately, we have a long history of what happens with nations in severe economic distress, when they have a symbolic, independent currency (not explicitly tied to another currency) [[ie, one whose production is not in any way constrained: normxxx]].

That history is that NOT one of those fiat currencies soared in purchasing power, despite the best efforts of the economically wounded nation to keep that from happening. No, the very well established pattern is that the currency collapses in value (price inflation) as the central authorities increase its production to 'stimulate' the economy, even as the purchasing power of assets is collapsing (asset deflation), much like what is happening with Iceland today. That collapse in the value of the currency necessarily forces a major redistribution of wealth, and the segment of the population that is most devastated by this seems always to be the same. It