Wednesday, December 3, 2008

Economies Continue To Unravel

World Stability Hangs By A Thread As Economies Continue To Unravel

By Ambrose Evans-Pritchard, Telegraph, UK | 1 December 2008

The political bubble is bursting. Spreads on geo-strategic risk are now widening as dramatically as the spreads on financial risk at the onset of the credit crunch.

Whether it is the Indian rupee, the Shanghai bourse, or Kremlin debt, the stars of the credit boom have fallen to earth. Investors are retreating into 3-month US Treasury bills— the ultimate safe-haven. The yield has fallen to 0.02%, less than zero after costs. You pay Washington to guard your money.

The working assumption of the "Great Boom" is— or was— that we live in a benign era where most societies are converging towards some form of market liberalism; where trade and capital flows are unrestricted; where governments have enough legitimacy to keep order by light touch; where a major war is unthinkable. This illusion is now being tested. We should not read too much into the Bombay carnage. It may or may not be significant that the Deccan Mujahideen— whoever they are— picked India's financial hub to launch their spectacular.

Even so, the love affair with Bombay's bourse was cooling anyway. The Sensex index is down almost 60% from its peak. The exodus of foreign capital may now quicken, laying bare the horrors of Indian public finance. The combined federal and state deficit is 8% of GDP. Plainly, spending will have to be slashed.

If the atrocity now propels the Hindu nationalist leader Narendra Modi into office at the head of a revived Bharatiya Janata Party (BJP), south Asia will once again face a nuclear showdown between India and Pakistan. Events are moving briskly in China too. Wudu was torched by rioters this month in a pitched battle with police. Violence has spread to the export hub of Guangdong as workers protest at the mass closure of toy, textile, and furniture factories.

"The global financial crisis has not bottomed yet. The impact is spreading globally and deepening," said Zhang Pin, head of the national development commission. "Excessive bankruptcies and business closures will cause massive unemployment and stir social unrest".

We are about to find out whether China has made the wrong bet with a development strategy of vast investment in manufacturing plant for mass export at thin margins to the US and Europe. The shocking detail in the World Bank's latest report on China is that wages have fallen from 52% to 40% of GDP since 1999. This is evidence of an economic model that is disastrously out of kilter, and unlikely to retain popular support.

The Communist Party lost its ideological mission long ago. The regime depends on perpetual boom to stay in power. As the economy sours, there must be a high risk that it will resort to the nationalist card instead. Tokyo certainly thinks so. When I visited Japan's Defence Ministry last year, the deputy minister showed me charts detailing the intrusion of China's fast-growing fleet of attack submarines into Japanese waters. "We see its warships in the Sea of Japan all the time," he said.

Shoichi Nakagawa, the head of the ruling LDP party, was even more explicit. "What happens when China attacks Japan? Will the US retaliate on our behalf?" he said. As for Europe, it is already fragile: Iceland, Hungary, Ukraine, Belarus, Latvia, and Serbia have turned to the IMF. Russia is a hostage to oil prices. If Urals oil stays below $50 a barrel for long, we are going to see an earthquake of one kind or another.

It is too early in this crisis to conclude whether Europe's monetary union is a source of stability, or is itself a doomsday machine. The rift between North and South is growing. The spreads on Greek, Irish, Italian, Austrian, and Belgian debt remain stubbornly high. The lack of a unified EU treasury has become glaringly clear. Germany has refused to underpin the system with a fiscal blitz.

In the 1930s, it was not obvious to people living through debt deflation that their world was coming apart. The crisis came in pulses, each followed by months of apparent normality— like today. The global system did not snap until September 1931. The trigger was a mutiny by Royal Navy ratings at Invergordon over pay cuts. Sailors on four battleships refused to put out to sea. They sang the Red Flag.

News that the British Empire could not uphold military discipline set off capital flight. Britain was forced off the gold standard within five days. A chunk of the world followed suit. Nor was it obvious that Germany would go mad. Bruning persisted with deflation, blind to the danger. The result was the election of July 1932 when two parties committed to the destruction of Weimar— the KPD Communists and the Nazis— won over half of the seats in Reichstag. [[And, foolishly, the government supposed that Hitler was the lesser of the two evils.: normxxx]]

We can hope that governments have acted fast enough this time— with rate cuts and a fiscal firewall— to head off such disasters. But then again, the debt excesses are far greater today. If in doubt, cleave to those countries with a deeply-rooted democracy, a strong sense of national solidarity, a tested rule of law— and [[nuclear weapons and: normxxx]] aircraft carriers. The US and Britain do not look so bad after all.

.

1930s Beggar-Thy-Neighbour Fears As China Devalues

By Ambrose Evans-Pritchard, International Business Editor | 3 December 2008

China has begun to devalue the yuan for the first time in over a decade, raising fears that it will set off a 1930s-style race to the bottom and tip the global economy into an even deeper slump. The central bank has shifted the central peg of its dollar band twice this week in a calculated move that suggests Beijing aims to offset the precipitous slide in Chinese manufacturing by trying to gain further export share abroad.

The futures markets are pricing in a 6% devaluation over the next year. "This is clearly a big shift in policy and we are now on alert," said Simon Derrick, currency chief at the Bank of New York Mellon. The move follows a Politburo speech by President Hu Jintao warning that China is "losing competitive edge in the world market". China has allowed a crawling 20% revaluation over the past three years. Any reversal risks setting off conflict with the incoming team of President-Elect Barack Obama in Washington.

Mr Obama has called China a "currency manipulator" during the campaign, a term that carries penalties under US trade law. Outgoing US Treasury Secretary Hank Paulson is viewed as a "friend of China". He called for a stronger yuan this week before embarking on a visit to Beijing, but the plea was couched in friendly terms. This soft-peddling may soon change.

Hans Redeker, currency head at BNP Paribas, said China's policy switch could set off a dangerous chain of events. "If they play this beggar-thy-neighbour game, it will cause a deflationary shock for the whole world," he said. It makes sense for countries with current account deficits such as the UK, US or Turkey to let their currencies fall, but China has the world's biggest trade surplus.

Michael Pettis, a professor at Beijing University, said it was "very worrying" that a pro-devalulation bloc seemed to be gaining the upper hand in the Communist Party. "I really do believe that we are on the brink of a very ugly period for trade relations," he said. China has relied on exports to North America and Europe as its growth engine, making it acutely vulnerable to the contraction in global demand.

Mr Pettis said this recalls the role played by the US in the 1920s, a parallel fraught with danger. "In the 1930s the US foolishly tried to dump capacity abroad, but the furious reaction of trading partners caused the strategy to misfire. China already seems to be in the process of engineering its own Smoot-Hawley," he said, referring to the infamous US Tariff Act of 1930.

China showed restraint during the Asian crisis in 1998, holding the line against domino devaluations across the region. It may yet hold the line this time. However, this crisis is more serious. The manufacturing sector has seen the steepest decline since records began, with devastation sweeping the textile, furniture and toy sectors. Civil unrest has begun to rock the Guangdong and Longnan regions.

Beijing has slashed rates and unveiled a fiscal stimulus of 14% of GDP, but most of the spending comes in the form of instructions to local governments to spend more— but without giving them the money. Does China really intend to step in to prop up global demand? The jury is out.

.

Is Britain Going Bankrupt?

By Ambrose Evans-Pritchard | 24 November 2008

The bond vigilantes are restive. We are not yet facing a replay of the 1970s 'Gilts Strike', but we are not that far off either. There is now a palpable fear that global investors may start to shun British debt as the budget deficit rockets to £118bn— 8 per cent of GDP— or charge a much higher price to cover default risk.

The cost of insuring against the bankruptcy of the British state has broken out— upwards— over the last month. Yes, credit default swaps (CDS) are dodgy instruments, but they are the best stress barometer that we have. Today they reached 86 basis points, near Portuguese debt in the league table. For good reason.

Alistair Darling has had to admit that the British economy faces the most sudden economic collapse since World War Two, and the worst budget deficit of any major country in the world. Ok, this is a lot lower than Iceland, Ukraine, Hungary, and other clients of the IMF, but is significantly higher than Germany (35 bpts), USA (43 bpts), and France (49 bpts). After trading at similar levels to our AAA-rated peers for years, we started to decouple in August and then began to soar in October.

We reached a fresh record the moment the Chancellor told the House of Commons that the budget would not return to its already awful condition until 2016. Should we be worried? Yes. Marc Ostwald from Insinger de Beaufort said Gilt issuance would reach £146bn in fiscal 2008/2009. Britain will have to borrow £450bn over the next five years.

This is an utter fiasco. With deep embarrasment, I plead guilty to supporting the Brown-Darling fiscal give-away— though with a clothes peg clamped on my nose. As the Confederation of British Industry and many others have warned, we face an epidemic of bankruptcies unless we tear up the rule book and take immediate counter-action.

The Bank of England's drastic rate cuts are a necessary but not sufficient stimulus. Monetary policy is failing to get traction because the credit system has broken down. We face the risk of a rapid downward spiral if we misjudge the threat at this dangerous moment, as we sit poised on the tipping point.

Besides, the whole world is now resorting to fiscal stimulus in unison under IMF prodding. Sticking together is imperative. If countries reflate in isolation, they can and will be singled out and punished. That is the lesson of 1931.

But this is not to excuse the Brown Government for the total hash it has made of the British economy. It presided over a rise in household debt to 165% of personal income. How could the regulators possibly think this was in the interests of British society? What economic doctrine justifies such stupidity? Why were 120% mortgages ever allowed? Indeed, why were 100% mortgages ever allowed? Debt is as dangerous as heroin.

Labour ran a budget deficit of 3% of GDP at the top of cycle. (We had a 2% surplus at the end of the Lawson bubble, so we go into this slump 5% of GDP worse off). The size of the state has ballooned from 37% to 46% of GDP in a decade, and will inevitably now rise further.

It is because Gordon Brown exhausted the national credit limit to pay for his silly boom that today's fiscal stimulus— just 1% of GDP (China is doing 14%)— is enough to rattle the bond markets. Our national debt will jump in what is more or less the bat of an eyelid from under 40% of GDP to nearer 60%— according to Fitch Ratings. It is enough to make you weep. But is this bankruptcy territory? Not yet. Britain will remain at the mid to lower end of the AAA club.

A Fitch study today estimates the "fiscal cost" of the bank bail-outs (which is not the same as just adding guarantees to the national debt) is 6.9% of GDP for Britain— compared to Belgium (5.7%), Germany (5.8%), Netherlands (6.3%), and Switzerand (12.9%). We are not alone in this debacle.

If and when the storm blows over, Britain should still have a lower national debt than Germany, France, or Italy. It will certainly have a better demographic structure that most of Europe (except France and Scandinavia), and less catastrophic pension liabilities than most. The situation is desperate, but not serious— as the Habsburgs used to say. Fingers crossed.

.

Germany Facing Worst Slump Since 1949

By Ambrose Evans-Pritchard | 24 November 2008

Euro-zone industrial orders plunged 3.9% in September and Germany's IFO index of business expectations has fallen to the lowest level since the survey began half a century ago, heightening fears of a severe slump across Europe next year.

French president Nicolas Sarkozy met Germany's Chancellor Angela Merkel in Paris yesterday to plead for stronger German support for an EU-wide rescue package. The talks come as the European Commission adds the final touches to a €130bn (£110bn) fiscal stimulus plan. Germany has clung steadfastly to budget orthodoxy but the downturn has now begun to engulf Europe's biggest economy with shocking speed. The Bundesbank is now expecting the worst recession since the terrible year of 1949, according to Deutsche Press Agentur.

Howard Archer, Europe economist at Global Insight, said the blizzard of dire data from the eurozone now points to a severe manufacturing slump. "Output, total orders, exports orders all contracted at record rates in November, which was alarming," he said. The broad IFO index of German confidence fell to the lowest since 1993 in November, but it was the unprecedented slide in the expectations index that most worried economists.

"This is extremely bad, it's even worse than the dog days of early 1970s," said Julian Callow, Europe economist at Barclays Capital. "German exports to the US, UK, Spain, and Italy have all collapsed, and the next shoe yet to drop is Eastern Europe," he said. Latvia has joined the queue waiting for an IMF bail-out, while Russia devalued the rouble again yesterday.

"The European Central Bank needs to cut rates very aggressively. They're trying to take this steady line, but this is a not the time for that. We think rates will be cut to 1.5% by February," he said. The ECB, which raised rates in a widely-criticized move in July, has since cut by just 100 basis points to 3.25%, largely staying aloof as the Anglo-Saxon central banks take drastic action to stop the downward spiral.

Adding to eurozone woes, the bloc's current account deficit doubled in September to €10.6bn despite the drop in the cost of imported oil. It is further evidence that the euro's surge to extreme levels of over-valuation in recent years has 'hollowed out' Europe's industrial base and inflicted damage that may take a long time to unfold.

ß§

Normxxx    
______________

The contents of any third-party letters/reports above do not necessarily reflect the opinions or viewpoint of normxxx. They are provided for informational/educational purposes only.

The content of any message or post by normxxx anywhere on this site is not to be construed as constituting market or investment advice. Such is intended for educational purposes only. Individuals should always consult with their own advisors for specific investment advice.

Monetizing The Debt

Monetizing The Debt

By Axel Merk | 3 December 2008

Deflation won't happen here; at least not if Federal Reserve (Fed) Chairman's Ben Bernanke's plan pans out. Deflation is considered a persistent decline in prices of goods and services; in a speech in 2002, Bernanke outlined the steps he would take if the U.S. ever faced the threat of deflation. Deflation will suffocate anyone holding debt as the debt burden becomes more difficult to finance with shrinking income; in contrast, inflation bails out those who have a lot of debt. In our assessment, fighting deflation is the Fed's top priority now; the latest minutes from the Fed's Open Market Committee (FOMC) meeting state:
"Indeed, some [FOMC members] saw a risk that over time inflation could fall below levels consistent with the Federal Reserve's dual objectives of price stability and maximum employment. …the limited scope for reducing the [Federal Funds] target further were reasons for a more aggressive policy adjustment; …more aggressive easing should reduce the odds of a deflationary outcome…"

To understand how "more aggressive" easing is possible when interest rates are close to zero, a little background is required on how the Fed is "printing" money. Until a few weeks ago, the Fed's main tool to control interest rates was to manage the Federal Funds target rate by engaging in "open market operations"— to buy or sell short-term government securities, mostly Treasury Bills. These operations are based on the principle that banks have cash deposits as reserves to lend money.

For any dollar on deposit, a multiple number of dollars may be provided as loans; the basic principal of modern banking [being] that not all depositors will want their money back simultaneously. But, if they do, a 'run on the bank' that may occur in such a situation that would either result in the Fed coming to the rescue or the bank's failure. In addition, the Fed can "tighten"
monetary policy by
selling, say, Treasury Bills in the open market.


[ Normxxx Here:  This last has the effect of lowering the price of all Treasury bills in the market (since they are now less scarce) and hence of raising interest rates (since the bills pay out a fixed dollar amount after issue). By making cash less available in the market place for these bonds, the cost of borrowing, i.e. interest rates, goes up. Conversely, the Fed can buy Treasury Bills, providing the market with increased cash, aka, 'liquidity'. By making bonds scarcer, their price goes up and, conversely, their yield goes down.  ]

This world was shaken when Congress, as part of passing the TARP bank bailout program, authorized the Fed to pay interest on [[on the reserve deposits of member banks': normxxx]] 'deposits' at the Federal Reserve. Theoretically, even if the Fed provides massive amounts of liquidity, interest rates should not go to zero as banks should always be able to go to the Fed and receive interest on deposits there. The idea is that the banking system could be flooded with liquidity while ensuring that [[short term: normxxx]] interest rates don't go down to zero.

Fed officials are fairly miffed that the market hasn't quite worked that way. Short term Treasury bills have hovered close to zero, even though the 'official' target Federal Funds rate is at 1%, and the interest paid on deposits at the Fed is at or near 1%. Note that many of the new programs the Fed has introduced have little or no historic precedent; as a result, the programs may not be effective or may have unintended consequences. [[They may even prove counterproductive!: normxxx]]

Aside from paying interest on deposits, the Fed, using the above model, can do a lot more to provide "liquidity". Namely, the Fed is not limited to buying and selling T-Bills, as recent announcements have shown. The Fed is free to buy just about anything: mortgage backed securities (MBS), car loans, commercial paper, to name a few. (The Fed could also buy typewriters, cars, domestic or international stocks— anything.) In an announcement on November 25, 2008, the Fed said it would buy up to $600 billion of mortgage-backed securities issued by the government-sponsored entities (GSEs) Fannie and Freddie.

For example, a bank would like some cash, but cannot find a buyer for the mortgage-backed securities it holds. The Fed may step in, buy the securities and provide the bank with the cash. The bank in turn is now free to lend the money— some multiple of the cash received.

How does the Fed get its money? It doesn't need to borrow it; it merely creates an entry into its balance sheet. All the Fed requires to "print" money is a keyboard connected to a computer. The difference between the Fed and the Treasury issuing money is that the Treasury needs to get permission from Congress before selling bonds. In this context, it shall be mentioned that physical cash (coins, bank notes) are entered as liabilities on the Fed's balance sheets; they are rather unique liabilities, however, as you can never redeem your cash: [[Treasury bills have not been redeemable since 1933: normxxx]]. While it is possible for central banks to remove cash in circulation, they are not obliged to do so.

Until recently, the Fed would only temporarily park non-government securities on its balance sheet, A bank would typically receive a temporary, often overnight, loan for depositing top rated securities with the Fed; these "swap agreements" were traditionally intended for very short-term loans, but the crisis has led the Fed and other central banks around the world to engage in 60, 90 day or even longer agreements. Since late September, swap agreements have been supplemented by outright purchases[[ of securities: normxxx]].

When the Fed issues [[new: normxxx]] cash [[ie, not borrowed from an existing holder of dollars: normxxx]] for the debt securities it acquires, we talk about "monetizing the debt". This can be taken yet a step further, although this last phase has not yet been implemented. When the government needs to raise money, the Treasury issues debt in form of Treasury bills and Treasury bonds.

To keep the cost of [[intermediate term and long term: normxxx]] borrowing for the government low, the Fed itself may step in and buy Treasury bonds. Whereas traditionally, the Fed actively manages short-term interest rates only, by buying and selling short-term Treasury bills, the Fed may also buy, say, 10- or 30-year bonds. It's a wonderful funding mechanism: if the Treasury needs to raise cash, the Fed could provide it as needed.

Isn't this extremely inflationary? Quite possibly, quite likely, but not necessarily is the short answer [[at least, not in the short run: normxxx]]. First of all, the Fed has the ability to "sterilize" its debt monetization program. Take the situation where the Federal Reserve buys "highly rated", 'toxic' assets from the bank, but doesn't want the bank to go out and lend a multiple of the cash it receives. What the Fed can do is to sell the same bank, for example, some Treasury bills to "mop up" the extra liquidity. This would have the impact of improving the bank's balance sheet without supercharging the economy.

Indeed, in late September the Treasury instructed the Fed to do just that. They even invented "Supplementary Financing Program" (SFP) bills for this purpose. On the chart below, the dark blue line indicates the cumulative growth in the Fed's balance sheet, i.e. the Fed's "printing of money"; the light blue line shows the cumulative activity to mop up the added liquidity by selling SFP bills to banks. The Fed's balance sheet has grown by about $1.2 trillion to currently over $2 trillion. Dallas Fed President Richard W. Fisher said the Fed's balance sheet may reach $3 trillion by January.


As even the untrained eye can see, the Fed has not mopped up all of its liquidity injections; indeed, as of October 22, 2008, the Fed seems to have all but abandoned the program. In our assessment, at least for the time being, the Fed is not interested in mopping up, but in adding massive amounts of liquidity.

Well, isn't that extremely inflationary? It depends on your definition of inflation; if it's a growth in money supply, then, yes, this is already extremely inflationary. But so far, this hasn't translated into higher price levels or even higher long-term inflation expectations as measured by the spread of 10 year TIPS versus 10 year Treasury bonds; TIPS are inflation protected Treasuries that provide compensation for increases in the consumer price index (CPI); it is this spread that the Fed is most concerned about when gauging the market's inflation expectations.

Why has it not (yet) been inflationary? Well, the Fed can provide all the money it wants, but it cannot force institutions to lend. Below is a chart of the "excess reserves" in the banking system; these are the reserves banks hold in excess of what they are required to maintain.(Fed statistical release H3, table 1 column 4):


Until September, excess reserves hovered at or below about US$2 billion, but have since ballooned to over $600 billion as of November 19, 2008. Read in conjunction with our discussion above on the Fed "printing money", the Fed has thrown money at the banking system, but the banks are hoarding the cash, they 'refusing' to lend [[often, not even to each other: normxxx]]. For banks to lend money, two basic conditions must be bet: they must themselves feel strong enough to provide the credit, and they must feel that their customers— be they consumers or businesses or even other banks— are sufficiently creditworthy.

Before we discuss the next step the Fed has taken in its [seemingly frantic effforts] to unlock credit [[ie, lending activity: normxxx]] in the economy, let's pause for a second to look at a potential unintended consequence. If you are a bank and don't want to lend to the private sector, but are awash in cash, what do you do? You can deposit the cash at the Fed and earn 1% interest; you can buy Treasury bills and earn approximately zero; or you can lend money to— the government. In our view, it seems a logical conclusion for banks to buy longer dated Treasury bonds.

Banks are [normally] in the business of borrowing short and lending long. Typically, banks have deposits (short-term loans from depositors or others such sources, eg, the 'commercial paper market', callable at any time) and [use that money] to lend to finance [other than Federal government] long-term projects. This may well be the greatest carry trade of all times, except that it has neither credit, nor currency risk; it does have interest risk, i.e. if long-term interest rates go up because the market prices in the risk of inflation, then the banks could lose money.

While Congress may be furious that banks are not lending, the Fed does have a conflicting interest in keeping the long-term cost of borrowing low. Under normal circumstances, the cost of borrowing should go up as unprecedented amounts of dollars need to be raised by the Federal government (eg, the Fed itself or the Treasury) to finance the various programs in the pipeline and for the additional spending programs expected by Congress. The cost of borrowing has the potential of going dramatically higher if Asian buyers [cannot] increase their [absorption of] U.S. debt. Asian buyers [[mostly Chinese: normxxx]] have, in recent years, purchased the majority of debt issued by the U.S.

Now, however, there's less trade with the U.S., and Asian governments need to stimulate their [own] domestic economies. While some may try to keep their exports cheap [[by keeping the value of their currency low with respect to the dollar, by purchasing U.S. debt: normxxx]], the Chinese approach of investing about US$600 billion [directly] into their domestic economy is more efficient. And unlike the U.S. government, the Chinese are sitting on over $2 trillion in foreign currency reserves [[about half of it in potentially toxic US dollars which they'd be only too happy to unload for something likely to prove more stable: normxxx]] and can afford to have a massive domestic stimulus package [[largely at the expense of the US dollar and US interest rates: normxxx]]. In our view, foreign governments are unlikely to be able to step in and keep U.S. borrowing costs low.

Never underestimate the Fed. If the money thrown at the banking system doesn't stick, i.e. doesn't result in easier credit for the rest of the economy, they can also be more targeted. As of November 25, 2008, the Fed has announced it will buy mortgage-backed securities in the open market to get the cost of borrowing down. Specifically, debt securities issued by Fannie and Freddie, the government sponsored entities, will be purchased.

Almost immediately after the announcement, the prices of these securities rose, causing the yields to go down. The goal of the Fed in this program is to keep the cost of borrowing for homebuyers low. While this will keep the cost of borrowing low for those who qualify for a loan, this program may do little to provide access to the mortgage market for those that have been shunned [by] it. This includes the difficulty for many of refinancing their home when its value is less than the value of the mortgage.

In our assessment, the Fed will do anything to keep the cost of borrowing low. This has included targeted purchases of mortgage-backed securities to help homeowners; this has included purchases of commercial paper to help corporate America; it has included providing banks with massive liquidity. And it may [eventually] include the outright purchase of government debt to help finance the spending programs in the pipeline.

What happens if the Fed keeps the cost of borrowing artificially low, either directly or indirectly? Traditionally, the Fed only controls the cost of short-term borrowing, but recent Fed actions set the stage for more active involvement throughout the yield curve, i.e. also for longer dated government bonds. Think about it from the vantage point of the potential buyer of Treasury bonds or Fannie and Freddie paper.

If the yield offered is artificially low, then potential buyers are likely to abstain. After all, there may be other investments whose price are less, or not at all, manipulated. Investors don't require a high, but a fair return on their money; they want to be compensated for the risk they are taking. This includes those who lend to governments.

In a world where the cost of borrowing is artificially lowered, it may be up to the Fed to be the backstop of all economic activity as other potential buyers become reluctant to act. [[In a deflationary world, stuffing excess cash into your mattress would do fine! : normxxx]]Paradoxically, it's precisely government debt that investors are looking for because of all the uncertainty in the private sector. However, as the U.S. does not live in a vacuum, international flows of funds do need to be considered.

A foreign investor may think twice before buying U.S. government bonds or agency paper, if they are not fairly compensated for the risk they are taking. Aside from our argument above that Asian buyers may not be able to finance U.S. spending, they may be put off by unattractive yields. After all, the massive stimulus under way should [eventually prove] highly inflationary.

But if the Fed succumbs to preventing the markets from pricing potential inflation into bond prices, there has to be a valve. This valve, in our view, will be the U.S. dollar. We cannot see the dollar hold up in face of the types of intervention that are under way and that we see play out. Incidentally, a substantially weaker dollar may be exactly what Fed Chairman Bernanke wants. He has repeatedly praised Roosevelt for going off the gold standard during the Great Depression to allow the [general] price levels to adjust to their pre-1929 levels [[ie, to combat deflation: normxxx]].

This is Fed-speak for praising the pursuit of inflationary policies. Bernanke's only criticism was that FDR didn't act fast enough. Similarly, Bernanke's criticism of the Japanese encounter with deflation has been that the Japanese have not acted forceful and fast enough to fight it. What he may [have overlooked] is that the Japanese have traditionally financed their deficits [and debt] domestically.

In the U.S., these days, most of the deficit [and debt] is financed abroad. The U.S. is lucky in that at least the debt is U.S. dollar denominated so that we can, at any time, repay the debt simply by printing more money. However, the value that foreigners may place on the U.S. dollar [[eg, in their own currency: normxxx]] may be substantially less, the more inflationary the policies that the U.S. is pursuing.

Many still believe in the infallibility of the Fed. Foremost, many support the massive liquidity push because they are firmly convinced that the Fed will mop up the excess liquidity when markets normalize. Indeed, without this confidence, the markets might [have already] overwhelmed the Fed and caused a disorderly outcome for inflation and/or the dollar.

Even we don't doubt that the Fed has the best of intentions. The Fed believes that the end justifies the means. However, we doubt the end will be as intended, thus doubly questioning the means. But just as the past 22 months have shown that the markets do not act exactly as Fed officials have anticipated, we cannot see that the Fed, Treasury and other government programs will work as designed.

While we don't rule out that an inflationary boom is possible, once the liquidity is starting to be mopped up, we are afraid, economic growth is likely to collapse once again. Unless real wages can be improved, consumers must de-leverage. Propping up a broken system will simply make the later crash even more severe.

[ Normxxx Here:  In other words, Axel forsees the same possibility of a general deflation interrupted by occasional bursts of runaway inflation, until we are all destitute, that I have written about earlier.  ]

Similarly, if Asian governments continue to support the dollar, they will seriously weaken their own economies. In a best-case scenario, we will then face the same challenges again in 10 to 15 years, but by then a country like China won't have $2 trillion in reserves, and have far greater difficulty in stabilizing its economy [[if it survives so long with an economy on the fritz: normxxx]]. The U.S. has taken the attitude that other countries must support the dollar because it is in their interest to do so. But there's a limit to what other countries can do; there's also a limit when it ceases to be in their own interests.

In particular, it is irresponsible for the U.S. to pursue a policy that is destructive to the dollar while counting on Asian governments to prop it up. In the meantime, responsible savers in the U.S. have their savings put at risk due to all the bailouts. A substantially weaker dollar may cause price levels to rise; as a result, the value of the dollar in international markets may be a better indicator of inflationary pressures to come than the yield curve that is distorted because of the various Fed programs. Fed Chairman Bernanke may want a weak dollar and inflation, but may ultimately be getting more than he is bargaining for.

We manage the Merk Hard and Asian Currency Funds, no-load mutual funds seeking to protect against a decline in the dollar by investing in baskets of hard and Asian currencies, respectively. To learn more about the Funds, or to subscribe to our free newsletter, please visit our site

The Grapes Of Wrath

The Grapes Of Wrath
Extracted From The Dec 2, 2008 Edition Of Richard's Remarks


By Richard Russell | 3 December 2008
Dow Theory Letters [big] snippet


The Bernanke-Paulson team is doing everything in its power to hold back the forces of deflation. The first indication that they're succeeding will be the stock market ceasing to deflate.

A trillion is the new billion. The government has thrown tens of billions [[trillions?: normxxx]] at the face of various deflating entities in a desperate attempt at halting deflation. It hasn't worked. The stock market's opinion, so far, is that "it's not going to work".

You can't cure the disease with more of the same "medicine" that caused the disease. The only cure for a crashing stock market is exhaustion, and it is probably the same for the US economy. The bear market in stocks has an economic equivalent— a severe recession, better known as a depression.

There is an inflection point somewhere ahead that will mark the death of deflation and the base for forthcoming inflation. We have not reached that inflection point yet. The stock market continues to deflate and the treasury bond market continues to discount deflation. If Bernanke and Paulson fail to halt deflation, we will be facing a deflationary disaster ahead.

It will wipe out all the leveraging and inflation built into the US economy since World War II. For years I've been writing that ultimately we will face the choice— "inflate or die." Depression and deflation are the economic equivalent of death. I saw it once, and I never want to see it again— which is what today's site is all about.

Maybe wealthy La Jolla isn't a fair test, but I walk around La Jolla, and life appears to go on as usual. No real changes except that I see more "Sale" signs on the retail shops, and I see more "For Lease" signs posted in the windows of various blacked-out store fronts. People are shopping, couples sit in the sun at outdoor restaurants chewing on hamburgers or sipping coffee. Nothing much has changed in dreamy La Jolla— it will.

What is changing is the stock market and the Treasury bond market. Treasury bonds are hitting new highs, as the conservative bond market crowd pours money into the Treasury market on the thesis that come what may, they'll always get their money back if they buy Treasuries (that is, unless the dollar tanks, I think to myself). Meanwhile, yesterday, the Dow was down over 679 points or 7.7%— so much for the five-day rally that served to get the bulls' hopes up.

My mind goes back to mid-1929. My parents are still giving cocktail parties for their friends (in those days, parties at restaurants were rare and unusual). My dad has just bought a Buick touring car, and we are preparing to take a ride to nearby Stamford, Connecticut. My sister and I are both going to private schools, and my mom is dreaming of getting out of the West Side and moving to the more "acceptable East Side".

Dad is looking over the stock tables in The New York Times, and he wonders why he has not been more adventurous— Dad will only buy two stocks, American Telephone with its famous $9 dividend and "recession-proof Woolworth," which he terms "the poor man's stock". During September through November of 1929, the market crashes. My uncle Irving jumps out of the tenth story window of a midtown Manhattan hotel. Irving commits suicide because his department store stock cuts its dividend in half (Irving lives on that dividend).

After the great crash of '29, nothing in Manhattan seems very different. I can still ride the subway to school, all the way to Riverdale for a nickel. And a good sandwich at the Automat still costs only 15 cents. I'm given 35 cents for lunch every day. I usually buy a sandwich or a plate of cheese macaroni for 15 cents and a piece of pie for a dime at the Automat.

One year later everything has changed. Men are out of work. The lines outside the employment offices are growing longer— some wind around the block. Tired men in patched clothes sit on the sidewalk with outstretched metal cups and signs that read, "Veteran, God bless you." The mood in the city is changing, and you can sense the fear in the air. My parents' friends are calling the house and discussing how much money they have lost in the stock market. Some have lost their jobs.

My father has a perpetual grim look on his face, he seems worried day and night. In the year 1939 my father loses his job. He suffers a nervous breakdown. My mom doesn't want me to see it, and they send me on a youth hostel bicycle trip to California. On that trip I see the "Grapes of Wrath" up close and personal.

California is filled with Okies and their beat-up trucks (people from Oklahoma who had fled the Dust Bowl and are looking for any kind of work in the Golden State). The California sheriffs and highway patrols are busy sending the poor Okies back home. "You want to work in California,bud? Forget it, we don't have enough jobs for our own." I'm stopped on my bike (I'm 16 years old) by the local sheriffs three times.

"Watcha doin' here kid? Lookin' for a job? Because if you are, I'm puttin' you on a box car and sending you back to wherever the hell you came from." "No sir, I'm with a Youth Hostel group. We're just sight-seeing." "Well you're not going to like the sights around here. And don't let me catch you lookin' for a job, kid. OK, get back on your bike— you can go."

Those were the fun days. I remember them well. And now I'm wondering whether we're headed for another round of such "fun days." The crashing stock market tells me it could happen. I don't want to see the days of 1939 ever again.

ß§

Normxxx    
______________

The contents of any third-party letters/reports above do not necessarily reflect the opinions or viewpoint of normxxx. They are provided for informational/educational purposes only.

The content of any message or post by normxxx anywhere on this site is not to be construed as constituting market or investment advice. Such is intended for educational purposes only. Individuals should always consult with their own advisors for specific investment advice.

Tuesday, December 2, 2008

Will Historic Returns => Additional Gains?

Monday Morning Outlook: Will Historic Returns Give Way To Additional Gains?
Can The S&P 500 Index Extend Its Historic 5-Day, 12-Percent Rally?

Click here for a link to complete article:

By Todd Salamone, schaeffersresearch | 1 December 2008

Today's in-depth look at the week ahead begins with a recap of last week's historic 5-day gain for the Dow Jones Industrial Average, despite the Thursday Thanksgiving holiday. Next, Schaeffer's Senior Vice President of Research Todd Salamone looks at the potential for solid market returns following the S&P 500 Index's (SPX) impressive 12% rally. Joe Sunderman, Vice President of Financial Market Analytics, dives into the Nova/Ursa ratio, and why you should keep a close eye on this sentiment indicator. Finally, we wrap up with a look at some key economic and earnings reports slated for release this week.

Recap of the Previous Week: The Dow Jones Industrial Average Posts Best 5-Day Point Gain Ever
By Joseph Hargett, Senior Equities Analyst

Last week was one for the record books for the Dow Jones Industrial Average (DJIA). Despite the shortened-holiday week, the Dow gained 1,277 points, or 17%, in just 5 sessions, marking its best 5-day percentage gain since 1932, and its best 5-day point gain on record. The venerable average kicked last week off with a bang, rallying 396 points, or 4.93%, after word hit the Street that the U.S. government would bailout Citigroup (C), thus dodging another Lehman Brothers-style collapse.

Tuesday's gain amounted to just 36 points for the Dow, but it kept the streak alive despite a downwardly revised third-quarter gross domestic product and news that the Federal Reserve would buy up to $600 billion in mortgage-backed securities. Traders regained their footing on Wednesday, as the Dow jumped 247 points, or 2.91%, heading into the Thanksgiving day break. The rally wasn't easy, however, as traders fought their way past the sharpest drop in consumer spending since September 2001, the fastest contraction in durable-goods orders in 2 years, and a 25-year high in the 4-week moving average of initial jobless claims. Wall Street was "closed" on Thursday for the holiday, but traders returned with sated appetites on Friday.

Despite anxiety over a potentially weak showing for Black Friday, the Dow rallied 102 points, or 1.17%, bringing the average's gain to 9% for the week. Still, the impressive 5-day rally wasn't enough to save November, as the DJIA dropped 5% for the month. Elsewhere, the S&P 500 Index (SPX) added 12% for the week, but lost 7% for the month. Finally, the Nasdaq Composite (COMP) rose 11% last week, but shed 10% for November.

What the Trader Is Expecting in the Coming Week: Does an Historic Weekly Return Indicate Continued Market Strength?
By Todd Salamone, Senior Vice President of Research

The S&P 500 Index (SPX) rallied 12% last week, raising an interesting question: When did we last see the SPX exceed a weekly rally of 7%, and what happened during the subsequent months? I'll answer this question in a moment, but first, let's rewind to the week that preceded this historic 1-week return in the SPX.

Two weeks ago, we experienced a 6.7% decline in the SPX, but an impressive late-Friday surge broke the selling fever on Wall Street, as news hit that President-elect Barack Obama would name Timothy Geithner as his Treasury Secretary. As a result, the SPX rallied back above its 2002 lows at 768.63 and its October 2007 half high at 788.05. As I mentioned in last week's Monday Morning Outlook, the late-Friday rally from 2 weeks ago put the bulls back on life support.

I discussed the 3 consecutive days in which the International Securities Exchange all-equity call/put ratio fell below 1.0, and the fact that the CBOE Market Volatility Index (VIX) traded at a premium to its 20-day historical volatility for the first time since October 10. As we now know, that build-up in short-term fear preceded announcements from President-elect Obama regarding members of his economic advisory team. Moreover, and perhaps more importantly, the government came out with 2 additional measures last week to ease the credit crisis: the $200-billion term asset-backed securities loan facility to help unclog consumer and small-business-related loans, and the $600-billion government-sponsored entities purchase program designed to target mortgage-backed securities at Freddie Mac and Fannie Mae.

The latter action pushed mortgage rates down, with the benchmark 30-year fixed rate at 5.76% heading into Friday, down from 6.77% only 4 weeks ago. Plummeting mortgage rates are the first major tailwind for the housing sector in quite a while. The culmination of this bottled-up fear in the market and the government action resulted in a huge rally in the SPX last week, further justifying our advice about positioning oneself for an "anything can happen" outcome.

Historically, the bulls can garner some encouragement from last week's price action. When the SPX notches a 1-week gain of 7% or more, the following 3 weeks to 3 months have proven extremely bullish for stocks. Specifically, the SPX returns, on average, between 2.47% and 9.13% during the 3-week to 3-month time frames following a 7% or greater move.


So, could we see a repeat of these types of returns in the weeks and months ahead? Most certainly, as we saw some heightened fear ahead of a catalyst that created a tailwind for the housing and refinance market. At the same time, keep in mind that volatility in the market is at historic highs, so exaggerated short-term moves may be less meaningful in their implications.

Moreover, the new measures designed to address asset-backed loans and mortgage-related securities are not due to launch until February 2009. With the aforementioned tailwinds in mind, the issue of hedge-fund redemptions still looms. In the blink of an eye, forced selling could once again engulf the market, sending stocks spiraling lower.

As we enter this week, we see potential resistance for the SPX at the 965 level, site of its 50-day moving average. Last month's high at 1,000 is also a level at which sellers could emerge. On the downside, the 850 level on the SPX could be supportive on pullbacks, as this marks the site of the October lows.

Should 850 break, we would prepare for a retest in the 768 or 788 levels, site of the 2002 low and half-high of October 2007, respectively. If you are looking for a sector to dip your toes in on the long side, we would recommend the housing sector, with stocks such as Meritage Homes (MTH) and Toll Brothers (TOL) rising to the top. Meanwhile, continue to avoid energy, technology, and pharmaceutical stocks.

Indicator of the Week: Nova/Ursa Ratio
By Joe Sunderman, Vice President of Financial Market Analytics

Background: A sentiment indicator that we monitor each day is provided by the Nova and Ursa funds from the Rydex Series Trust. The Nova fund is designed to have a target beta of 1.5. In other words, using equities, stock index futures contracts, and options on those securities and futures, the fund has a target performance benchmark equal to 150% of the S&P 500 Index (SPX). Traders who invest in this fund are considered bullish on stocks. Meanwhile, the Ursa fund is designed to provide a performance inverse to that of the SPX by using a combination of short selling and options on stock index futures. Investors in this fund are considered bearish on stocks.

Data Interpretation: We can get an accurate view of the sentiment picture by comparing the amount of assets in each fund. Specifically, we divide the total adjusted assets in the Nova fund by the total adjusted assets in the Ursa fund to arrive at a Nova/Ursa ratio. A high Nova/Ursa ratio indicates an extreme amount of optimism (everyone investing in Nova bullish fund). A low Nova/Ursa ratio indicates an extreme amount of pessimism (everyone flocking to Ursa bearish fund). We have frequently found that lows in the Nova/Ursa ratio precede rallies in the SPX, while peaks in sentiment will often front run a decline in the index.

Current Reading: Below is a graph of the Net Asset Value Adjusted Nova/Ursa Ratio. The current reading for this sentiment measure is 0.89, meaning the adjusted assets of the Nova Fund amount to 89% of the adjusted assets in the Ursa Fund.


Implications: Concerning us at this moment is the promptness of Rydex fund speculators moving assets from Ursa Funds (bearish fund) to Nova Funds (bullish assets). Our interpretation of the data is that fund traders are looking for a bottom too readily. As seen by the previous peaks in the data (circled areas on graph), this level of optimism (as defined by the Nova/Ursa ratio) has been ill-timed the past several months.

Given that the market is "overbought" by Relative Strength Index (RSI) measures, and the Rydex herd is moving into bullish funds, we recommend defensive positioning following last week's bear-market rally. As Bernie Schaeffer has mentioned in the Option Advisor commentary, "I would remain quite defensive, looking to hedge any long stock exposure with shorts or with put positions on ETFs, including the "double inverse" ETFs on such still-vulnerable sectors as energy and technology."

This Week's Key Events: November Nonfarm Payrolls on Tap
By Joseph Hargett, Senior Equities Analyst

Here is a brief list of some of the key events for the upcoming week. All earnings dates listed below are tentative and subject to change. Please check with the respective company websites for official reporting dates.

Monday

The economic calendar starts off light on Monday, with the release of October's construction spending report and the November Institute for Supply Management's (ISM) manufacturing index. In earnings news, Inergy (NRGY), Linktone (LTON), and Shanda Interactive (SNDA) are scheduled to release their quarterly reports.

Tuesday

Data is light on Tuesday, with only November's automobile and truck sales slated for release. In earnings news, Beazer Homes (BZH), Solarfun Power (SOLF), Marvell Technology Group (MRVL), and OmniVision Technologies (OVTI) are scheduled to release their quarterly reports.

Wednesday

The economic calendar heats up on Wednesday, as the November ADP Employment report, the revised third-quarter productivity report, the ISM services index, and the Fed's Beige Book are scheduled for release. In earnings news, Del Monte (DLM), Aeropostale (ARO), Collective Brands (PSS), and Jo-Ann Stores (JAS) are scheduled to release their quarterly reports.

Thursday

The pressure lightens up on Thursday, as only weekly initial jobless claims and October's factory orders are on tap. In earnings news, Toll Brothers (TOL), Williams-Sonoma (WSM), Guess (GES), Novell (NOVL), and Wind River (WIND) are scheduled to release their quarterly reports.

Friday

All eyes will be on Friday's economic data, with the release of November's nonfarm payrolls, the unemployment rate, hourly earnings, and average workweek. Capping off the day, October's consumer credit report is slated to hit the Street. In earnings news, Blyth Industries (BTH) is scheduled to release its quarterly reports.

And now a few sectors of note.

Dissecting The Sectors

Sector: Housing— Bullish

Outlook: Since bottoming near the 54 level in late November, the PHLX Housing Sector Index (HGX) has rallied more than 45%. Contributing to this resurgence in the housing market has been the government's moves to bolster lending to consumers, with particular focus on mortgages. Specifically, the Federal reserve announced a $600-billion government-sponsored entities purchase program designed to target mortgage-backed securities at Freddie Mac and Fannie Mae.

This move pushed mortgage rates lower, with the benchmark 30-year fixed rate at 5.76% heading into Friday, down from 6.77% only 4 weeks ago. Despite the government action and strong technical performance, investors remain heavily bearish on housing stocks. Specifically, Toll Brothers' (TOL) Schaeffer's put/call Open Interest Ratio (SOIR) of 1.42 rests in the 92nd percentile of its annual range, while Meritage Home's (MTH) SOIR has ballooned to a reading of 5.44, meaning that puts more than quintuple calls among near-term options.

Additionally, Wall Street is betting against the group. 5 of the 6 analysts following MTH rate the share a "hold," while 5 of the 10 brokerage firms covering TOL have issued "hold" or worse ratings. An unwinding of this negativity could help pressure the housing sector steadily higher.

Sector: Energy— Bearish

Outlook: The deteriorating economic environment has left many sectors beaten and battered, but few have felt the impact quite as directly as the energy sector. Specifically, crude-oil prices have plunged more than 63% to about $54.43 per barrel since peaking at $148.35 in early July. Underscoring this decline is the lowered global demand forecasts for crude oil by the International Energy Agency and the lack of any price support following production cuts by the Organization or Petroleum Exporting Countries (OPEC). Against this backdrop, the Select Sector Energy SPDR (XLE) has dropped more than 36% since late January.

The exchange-traded fund is battling resistance at its 10-week moving average, which has taken up residence just above the round-number 50 level— potentially bolstering this technical hurdle. Despite this poor price action, the XLE's Schaeffer's put/call Open Interest Ratio (SOIR) of 1.20 rests at an annual low, indicating an extreme degree of optimism from the speculative options crowd. Should this wealth of optimism begin to unwind, it could provide additional selling pressure for the sector.

Sector: Large-Cap Technology— Bearish

Outlook: Technology stocks continue to lead the major market indices lower. The tech-laden Nasdaq Composite (COMP) dropped 10% in November, outpacing its Wall Street brethren. Furthermore, the index remains below resistance at its declining 10-week and 20-week moving averages.

In addition, the Select Sector Technology SPDR Fund (XLK) is trading below resistance in the 15.50-16 region. On the sentiment front, there are still a number of overloved names within the technology sector. Microsoft (MSFT) has garnered 17 "buys" and 4 "holds," while Google (GOOG) has acquired 21 "buys," 2 "holds," and no "sells".

Even Apple (AAPL), with its year-to-date decline of more than 53% remains a heavy bullish favorite. Currently, AAPL's SOIR of 0.73 rests below 83% of all those taken during the past year, while 15 of the 21 analysts following the shares rate them a "buy" or better. With losses mounting, and confidence in the sector declining in the current economic environment, we could see this bullish sentiment unwind in the form of added selling pressure.

  M O R E. . .

Normxxx    
______________

The contents of any third-party letters/reports above do not necessarily reflect the opinions or viewpoint of normxxx. They are provided for informational/educational purposes only.

The content of any message or post by normxxx anywhere on this site is not to be construed as constituting market or investment advice. Such is intended for educational purposes only. Individuals should always consult with their own advisors for specific investment advice.

Corporate Insiders In Buying Frenzy

Corporate Insiders In Buying Frenzy

By tradersnarrative.com | 24 November 2008

As the market races to the bottom, corporate insiders are racing right along buying with both hands. For the past four weeks, insider activity as monitored by InsiderScore, corporate executives and board members have been in what can only be described as a buying frenzy. According to InsiderScore, "insiders are more bullish now than at any time since the two weeks immediately following the Black Monday market crash of October 1987".


Source: InsiderScore.com and SentimenTrader.com

I checked with a similar service that tracks Canadian stocks: Canadian Insider and not surprisingly, the Canadian market is showing a similar pattern of insider buying. The pattern was especially noticeable for Canadian REITs. And I’m not referring to ESOP where there is a preset schedule. REIT insiders are going out into the market and buying of their own volition. RioCan REIT, which I mentioned a few days ago, had 11,440 units purchased just on November 19th and November 20th, as an example.

The same can’t be said about precious metal stocks. For example, Barrick (ABX) and NovaGold (NG) do not show any buying interest from corporate insiders. If anything, there is a slight bias of selling. Which means that while insiders as a group are very bullish, they are still being selective. The k-ratio fell to 0.23 and has rebounded with Friday’s move in gold. That’s getting close to an attractive level for gold stocks, but if we are headed for a deflationary spiral, gold doesn’t stand a chance. But so far, the Philadelphia Gold Bugs Index (HUI) has bounced off the 175 level which I mentioned would act as support.

There’s Always A But

A caveat to consider: in September 2007 insiders were enthusiastic buyers. Although not nearly as much as now. That uptick in buying was, of course, not very profitable since most stocks topped out shortly afterward. The question now is, does today’s frenzy mean that insiders see real value or will we simply see the market fall more and insiders get even more excited about buying?

Whatever the answer to that, the solace that the current buying pattern does provide is that insiders are not selling. The worst possible scenario after all, would be to see the "smart money" insiders bail out after the market’s face melting 50%+ decline.

ß§

Normxxx    
______________

The contents of any third-party letters/reports above do not necessarily reflect the opinions or viewpoint of normxxx. They are provided for informational/educational purposes only.

The content of any message or post by normxxx anywhere on this site is not to be construed as constituting market or investment advice. Such is intended for educational purposes only. Individuals should always consult with their own advisors for specific investment advice.

Things Looking Up— A Little

Things Looking Up— A Little

By David Chapman | 2 December 2008

We are only a week or so from the lows of November 20 but seven weeks from the momentum low made on October 10. And we couldn't help but notice that fewer stocks made new lows on November 21 than were made on October 10. This tells us that we are still trying to form a low of some importance. This does not rule out new lows or a test of the November 21 lows, quite possibly even in December, but we are seeing signs that things are looking up— at least a little.

The seasonals have shifted in favour of the bulls. If the old adage of "sell in May and go away" was particularly vicious this year, then quite possibly "buy when it snows" will counter some of that gloom. Okay, we have seen at least one decent snowfall. So we guess that counts. But the reality is that most bear markets end in November or early December. Tellingly, the famous 1974 bear market low was made on December 6. The momentum low was made two months earlier, on October 4.

So here we are, nearly two months from our momentum low. That is why we can't rule out another test of the lows or even a new low, but once that is out of the way we should be into what is referred to as the best months of the year: January to April. What drives this investment pattern is not Santa Claus but strength from corporate and private pension funds, then the drive by the institutions, mutual funds, pension funds and banks as they place the funds they receive in the early part of the year.

Given the devastation of the past few months, many are wondering about the likelihood of not only the traditional Santa Claus rally appearing but also the early year market strength. Santa Claus failing to show up would be a signal that the bear will continue. Last year was a disaster as the market topped in October and collapsed into November.

Then, after a brief rally in early December, and then another that made a lower high in late December, we were suddenly confronted by a collapse into January 2008. Following another brief rebound, we experienced a final collapse into March that ended with the disappearance of Bear Stearns into J P Morgan Chase. Another slightly longer rally lasted into May, and we once again started a collapse that in a sense has still not ended.

But if this collapse has been historic, then the rebounds that follow historic collapses can often be equally dramatic. That means if you hadn't sold before the collapse got underway, then selling into the carnage was absolutely the wrong strategy. Exceptions are those stocks that just go bankrupt.

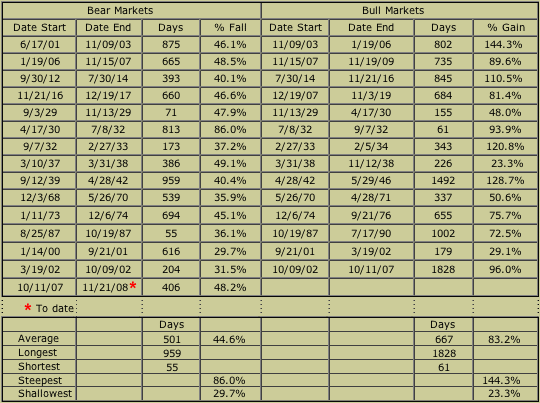
But it was not unusual to see good companies crushed along with the bad. Such is the nature of financial panics. We have documented the major bear markets of the past century and the bull market that followed them. All data is for the Dow Jones Industrials (DJI) and we are only focusing on bear markets of 30 per cent or more (okay one is slightly under 30 per cent).


Click Here, or on the image, to see a larger, undistorted image.


We can't help but notice that of the 15 bear markets of some depth, 8 of them ended during the October through December period. November leads with 4, October, December and July saw 2 endings, while February, March, April, May and September had 1 each.

The 86 per cent collapse from April 17, 1930 was the Great Depression crash. It was interrupted by a number of mini bull markets ranging from about 20 to 30 per cent. The 1933-37 bull market that rivalled the one completed in 2007 was actually interrupted by a 23 per cent decline from February to July 1934. After that mini-bear was out of the way it was straight up to the highs of March 1937 for a market gain of 127 per cent.

Setting aside 1930-32, major bear markets were seen in 1901-03, the financial panic of 1906-07, the 'war' bear of 1916-17, the crash of 1929, the panics of 1937-38 and 1973-74 [[that last needs to be seen inflation adjusted: normxxx]]. All of these bears lost from 45 to 49 per cent. All were followed by rallies that on average gained 77 per cent. The feeblest rebound was the one out of the 1937-38 financial panic where the DJI gained only 23 per cent. This was then followed eventually by the war years bear of 1939-42 that lost 40 per cent.

We have noted how, throughout this decade, we have followed the general pattern of the 1930s to a remarkable degree. Naturally it is difficult to predict confidently that we will now follow the period 1938 to 1942, but if we were to do so then the forthcoming rebound will not be particularly robust. We could follow some ups and downs, but gain 25-30 per cent into late 2009 or even early 2010, before we embark again on a more relentless down move that will take us into 2012. Whether that bear makes lower or higher lows is clearly difficult to predict. First, we have to have the rebound.

A feeble rally of 25-30 per cent into 2009 is the worst case. The best case is a surprise rally that takes us up by 70 per cent or more. If the rally is to get underway, December is the ideal time. We could see an attempt at another low sometime in the first week or two of December but then the Santa Claus/January effect rally should get underway. Rallies may be led by better than expected Christmas sales results or even into the New Year with what we might call the Obama bounce.

Despite last year's weak market, odds favour this year returning to the more normal positive late year market. After the devastating collapse of the past few months any respite would be welcome. In our Scoop of November 24, we noted some $4.3 trillion in commitments from various US government entities. Given the most recent $800 billion commitment in new lending programs, that number now soars to $7.8 trillion in direct and indirect financial obligations.

According to an article in the New York Times (Tracking the Bailout— November 25, 2008), the rescue plan includes $1.7 trillion in loan commitments to Bear Stearns, AIG and others; $3 trillion in buying stock in banks such as Citigroup and others, as well as buying mortgages; and $3.1 trillion in guarantees for corporate bonds, money market funds and deposit accounts. It is roughly half the GDP of the USA.

Right now the focus and fear has been on deflation, but the reality is that ultimately [our desperate 'bailout' plans are wildly] inflationary and we have noted that [they] could imperil the credit rating of the US Treasury. It is also unknown just how much in losses the US taxpayer will have to face. The massive amounts of funds needed for these bailouts could trigger the first trillion dollar budget deficit and the US government crowding out other borrowers for cash. All of this with appropriate lags can only lead to a depreciation of the US dollar and a monetizing of or inflating away of the problem. This is a problem for bond holders.

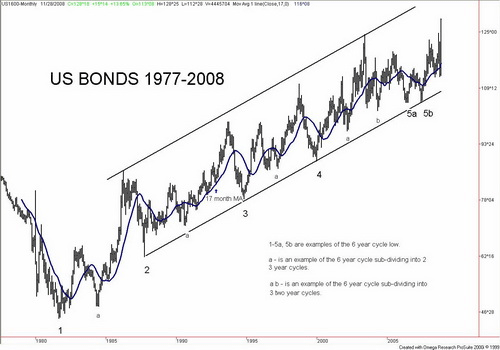
The long-term bond cycle has been in an uptrend since the lows of September 1981— a period of 27 years. This is very lengthy. Merriman has noted that the bond market appears to exhibit cycles of roughly 18 years. This cycle is itself broken down into smaller cycles of six years and that sub-divides into either two-year or three-year cycles. Since we have been rising now for 27 years we may note that the last 18-year cycle undoubtedly bottomed in 2000.

Our long-term chart of US bond futures shows these cycles. The six-year cycle is shown with the lows in 1981 (1), 1987 (2), 1994 (3), 2000 (4), and the double bottom low in June 2006/May 2007(5a and 5b). This tells us that the next six-year cycle low is due 2012-13. If the 18-year cycle bottomed last in 2000, the next is not due until at least 2018. We have also marked the interim cycles. We note the three-year cycle lows in 1984, 1990 and 1997 (a) and the subdivision into two-year cycle lows in 2002 and 2004 (a, b).


Click Here, or on the image, to see a larger, undistorted image.


The recent rally in bonds has been nothing short of spectacular as we soared from lows in October to new all-time highs in November. It is possible that we are seeing not only the top of the current six-year cycle but also the top of the entire 18-year cycle. We don't yet know whether the current six-year cycle will break down into a pair of two-year cycles or remain as one three-year cycle.

If the former, the low is due next year sometime; if the latter, our low won't be seen until 2010. We would expect in the next up portion of the cycle we would make lower highs. Another break of the 17-month moving average would confirm that a top is in.

For whatever reason we now seem to have a bubble in bonds. [[The planned outcome of the Fed and Treasury actions!?!: normxxx]]. Interest rates have fallen to almost unheard of levels. Ten-year bonds have dropped under 3 per cent to 2.93 per cent and even 30-year bonds have fallen to 3.45 per cent. Two-year notes are down to one per cent, and three-month Treasury Bills are pretty much paying nothing. The most recent CPI numbers point to an inflation rate of 3.7 per cent. At no point on the yield curve are rates above the rate of inflation. Yet clearly the expectation is that inflation will fall. Hence the current fear of deflation. Normally bonds should yield an interest rate of up to 2 per cent over the rate of inflation.

Deflation was the 'bug-a-boo' of the Great Depression. Today's monetary authorities are fearful of deflation and will do whatever is necessary to prevent it; inflation will be acted upon, but only belatedly. That can only mean one thing: massive monetary stimulus, which is exactly what we are seeing with the $7.8 trillion so far extended or announced. The huge increase in the monetary aggregates (M1, M2) plus the huge increase in the monetary base seen recently are ultimately inflationary, not deflationary. Although, normally, there is a perceptable lag between monetary stimulation and an improvement in the stock market or economy.

It seems particularly since the 1970s that it has taken increasing amounts of debt to generate another dollar of GDP. According to John Mauldin of Investor Insight, in the 1960s a dollar of debt bought $0.64 of additional real GDP (or, $1.56 of debt bought $1 of GDP). By 2007, $6.67 of debt was needed to purchase $1 of GDP. Today it would be substantially higher. Much of the massive growth of debt in recent years has been generated by the consumer to buy something which is ultimately perishable, eg, homes or lavish vacations. Neither is particularly productive for the economy[!?!] [[It keeps people employed! : normxxx]] As we have said, the consumer has being living in a world of illusion fuelled by debt.


Click Here, or on the image, to see a larger, undistorted image.


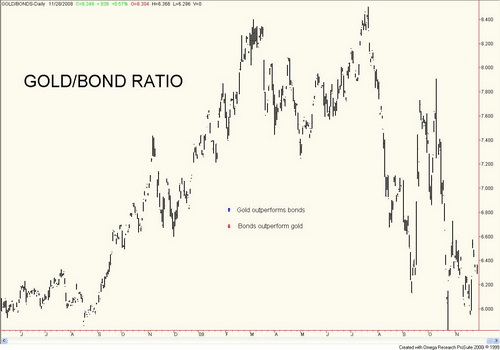
Bonds of course are considered a 'safe haven' investment. But so is gold considered a safe haven investment. Of late they have taken turns being the safe haven investment of choice.

Our chart of the Gold/Bond ratio shows that in the early part of this crisis, Gold was the preferred safe haven as the ratio rose from just under 6 in August 2007 to highs of 8.4 in March 2008 and 8.5 in July 2008. After that July high, the safe haven investment of choice became bonds as the ratio plunged to lows in September near 6. Following a sharp rebound for Gold the ratio topped on October 10, 2008 (timed with the market low) at 7.9. Once again the safe haven shifted to favour bonds and on October 24, 2008 the Gold/Bond ratio bottomed again at 5.8.

The past few weeks have seen a slight shift back to Gold, although it clearly has been choppy. A higher low on the ratio was seen on November 20, 2008 once again coinciding with the stock market low. Since then the momentum has shifted slight back to Gold's favour, and we would not now be surprised to see the momentum fully shift to Gold's favour. We would definitely own Gold over bonds right now.

While things are looking up a little for stock holders as we search for a bottom of some substance, those holding bonds— particularly longer dated bonds— may wish to head for the exits.

ß§

Normxxx    
______________

The contents of any third-party letters/reports above do not necessarily reflect the opinions or viewpoint of normxxx. They are provided for informational/educational purposes only.

The content of any message or post by normxxx anywhere on this site is not to be construed as constituting market or investment advice. Such is intended for educational purposes only. Individuals should always consult with their own advisors for specific investment advice.

Monday, December 1, 2008

Investment Strategy : “Buy and Hold Is Dead?!”

Investment Strategy

By Jeffrey Saut | 2 December 2008

"The other reliable indication of the start of an upward swing is afforded when, after a period of declining prices or, less frequently, dullness, the market advances or refuses to go down following the receipt of bad news. It is not enough that there should be temporary strength in these circumstances; the best of the market position should be applied for an entire day, and stocks should be bought only when, after thorough dissemination of unfavorable news, the market finally advances above the point where it was before the news was received."

……Don Guyon, from the book "One-Way Pockets"

"One-Way Pockets" was written by an unknown author using the nom de plume of Don Guyon. The book was first published in 1917, while we first encountered it in the 1970s after hearing it was legendary strategist Bob Farrell’s favorite book on investing. The aforementioned quote, which can be found on page 36 of said book, seems to be as insightful today as it was 91 years ago because human nature doesn’t change.

Speaking to "the market advances or refuses to go down following the receipt of bad news," two stocks that have been in a death spiral for months "coughed up" some pretty horrific news recently, but their share prices actually went up. Not only did they rally, Citigroup (C/$8.29) has gained 172% since a week ago Friday while General Motors (GM/$5.24) tacked on 136%. Moreover, since the October 10, 2008 "capitulation alert," the economic news has been dour yet stocks have not meaningfully traveled lower. As Barron’s noted a week ago:

"For a bullish spin, though a weak one, the market has not made a significantly lower low since October 10th. The word ‘significantly’ is important because some major market indexes, including the Nasdaq, have indeed been setting new lows. But the trend, if we can call it that, has been more sideways than decidedly down. A better, but still weak, bullish angle comes from trading volume, or the amount of money committed to either the bull or bear side each day. All of the higher volume days that have occurred since October 10th have come on days when prices rose. Theoretically, when prices are going up and volume increases, it means that investors are chasing the market higher. That's a sure sign of demand. Subsequent declines occurred with lower volume, so we can conclude that the desire to sell was not quite as strong as it was before October 10th."

Recall that on October 10th that of the 3,130 stocks traded on the NYSE, a shocking 2,901 of them made new yearly "lows." Accordingly, that 92.7% "new low" ratio registered the first "capitulation alert" in decades. Interestingly, all subsequent lower price readings for the major market indices were accompanied by "new low" ratios nowhere near as austere. And, when the DJIA’s (8829.04) nadir arrived on November 20th, of the 3,271 stocks traded on the NYSE that day, only 1,894 made new yearly lows (a 58% ratio).

Further, at those November lows the S&P 500 (SPX/$896.24) had lost some 52% of its value since its October 2007 "high." Categorically, I can find nowhere in the market’s history where the major market averages have fallen by 50% and there has not been a 'substantial' [[more than a week, anyways: normxxx]] "throwback rally," even if the averages eventually went lower. Additionally, while the S&P 500 marginally undercut its 2002 price lows, the DJIA did not, and that’s a huge downside non-confirmation.

When such pricing action is combined with other metrics, like the oft-mentioned oversold condition, the Volatility Index (VIX/55.84) closing below its 50-day moving average, the extremely bearish investors’ sentiment readings (read that as bullish), the lowest percentage of analysts’ "buy" ratings EVER [[also bullish: normxxx]], etc., was it any wonder that over the past five sessions the S&P 500 registered one of its best weekly skeins in history? As our technical analyst Art Huprich presciently wrote a week ago:

"As a result of Friday’s action, which I think was very important psychologically, the SPX recaptured its breakdown point of 768 (2002 low), after only one day. This is why I felt it was better to wait until the end of the week and possibly this month, before passing judgment. I still feel that way! Consequently, I am not yet willing to say that the SPX has violated its 2002 lows. I believe the SPX and DJIA are at critical inflection points! Within the context of a long-term ‘structurally fair’ market, in which the DJIA moved sideways for a decade or more, similar to 1966 to 1982, 1929 to 1949, and 1901 to 1915, in light of testing five to six year lows, this is a spot for a stock market bottom to attempt to form."

Inferentially, another important observation can also be gleaned from the book "One-Way Pockets." To wit— at the top of bull markets participants want to be investors; at the bottom of bear markets participants want to be 'traders'. To this point, the media is recently replete with the mantra, "buy and hold is dead!" I heard it numerous times again last week, and when one particularly wrong-way wonk uttered it, after being bullish for the past 10 years with a buy and hold strategy, I found myself screaming at the TV screen, "Jack, you are an idiot!" Ladies and gentlemen, the time to be a 'trader' was a year ago, not here at the best valuation metrics seen in a decade. As Société Générale’s James Montier states:

"This is a value investor’s version of heaven. From a bottom-up perspective, the equity market is offering some excellent companies at truly bargain prices for those with the fortitude to shut their eyes, or at least switch off their screens and buy. With all these opportunities available I have never been more bullish. Will I be early? Almost certainly yes, but if I can find assets with attractive returns and I have a long time horizon I would be mad to turn them down."

Even a somewhat more cautious Barton Biggs of Traxis Partners recently stated,
"I have no idea when the next bull market starts, but I do think we are setting up for the mother of all bear market rallies. Stocks around the world are cheap, stock markets have been obliterated and are deeply oversold, the fabric for economic healing is developing, and we must be pretty close to maximum bearishness."
Plainly we agree, which is why we have been recommending that accounts position themselves accordingly since the October 10th "capitulation alert." More recently, we noted a "capitulation alert" was registered for commodities as well.

The call for this week: Last week Wall Street experienced one of its biggest weekly gains since the five-day surge that ended the great bear market of 1929— 1932. We think the "lift" was driven by America’s new regime, as well as the Citigroup bailout, which unlike the previous bailouts did not wipe out the equity holders. According to the good folks at Bespoke, however, following such skeins the markets historically have retreated the next week by 2.4%. Nevertheless, we have had ten 90% downside days since September 2008. Then on November 24th we had a 90% upside day.

Based on the 70-year history of Lowry’s data, a series of 90% down-days followed by a 90% up-day often signals the end of a bear market. Like Barton Biggs, we too don’t know when the next bull market will begin, but if the DJIA can better its November 4th high of 9625.28, and is confirmed by the D-J Transportation Average (DJTA/3215.20) besting its November 4th high of 4071.81, it would certainly be a step in the right direction. Whatever the outcome, we have, and continue, to treat the October 10th "capitulation lows" as a bottom for the short-to-intermediate term, until proven wrong. Still, this is the most difficult market we have seen since the 1970s, which is why we are employing a hedging strategy and continue to emphasize clean balance sheets, decent fundamentals, and dividends. We continue to invest accordingly.

[ Normxxx Here:  WARNING— Bears be EXTRA cautious here!  ]

ß§

Normxxx    
______________

The contents of any third-party letters/reports above do not necessarily reflect the opinions or viewpoint of normxxx. They are provided for informational/educational purposes only.

The content of any message or post by normxxx anywhere on this site is not to be construed as constituting market or investment advice. Such is intended for educational purposes only. Individuals should always consult with their own advisors for specific investment advice.