Sunday, November 29, 2009

Waiting For The "R" Word

Investor Sentiment: Waiting For The "R" Word

By TheTechnicalTake | 29 November 2009

As expected, last week's holiday infested market action provided little clarity. The sentiment picture remains relatively unchanged. Nonetheless, there was a market moving event, and the "default in Dubai" will likely leave investors with one or both of two conclusions: 1) coordinated efforts by central bankers to re-liquify the world economy are likely to continue as bad news means good news— the proverbial punch bowl will be with us for awhile; and/or 2) the house of cards— otherwise known as 'the recovery'— is beginning to look a little wobbly; central bankers, no matter how hard they try, are unable to fight the forces of deleveraging [[indefinitely: normxxx]]. This contagion just won't go away so easily.

The "default in Dubai" is interesting as this now becomes a test of central banker resolve to keep the balls in the air. The US equity rally has been looking a little weak over the past two months and this could be the scare that moves a lot of money to the sidelines. Where there is one cockroach, there are bound to be others. But I suspect this will be passed off as nothing more than a hiccup, and will unlikely derail the bullish fervor. The only thing that can do that is lower prices.

What the "default in Dubai" says is that risks are mounting. This is not "wall of worry" nonsense. This is just common sense after a 60% plus move in the S&P500 over 8 months. Common sense often doesn't work in the markets, but fundamentals, valuations, technicals, and sentiment do not support higher prices. [[But since when does the market 'take advice', or do what it is supposed to do!?!: normxxx]] Dollar devaluation and ongoing Federal Reserve complacency are reasons why stocks can go higher, but I suspect this will have its limit. It is not a reason why I would be a buyer of equities with the expectation that this represents a golden buying opportunity. I am just waiting for someone on CNBC to utter the "R" word: resilient. When you hear that word, make sure you run for the exits.

From my data driven perspective, I will restate what I said last week (and for many weeks before that):

"The major equity indices are in a topping process. This implies a trading range at best. There is risk of a down draft as markets "fueled" by the proverbial "liquidity" are prone to quick sell offs. The outlier trade is a market 'blow off' or a 'spike' in prices, and I do not rule this possibility out because of the ongoing downtrend in the Dollar Index. It is possible, but it is not the high odds play. This is not the market environment that will take you from here to there."

The "Dumb Money" indicator, which is shown in figure 1, looks for extremes in the data from four different groups of investors who historically have been wrong on the market: 1) Investor Intelligence; 2) Market Vane; 3) American Association of Individual Investors; and 4) the put call ratio. The "Dumb Money" indicator shows that investors are extremely bullish.

Figure 1. "Dumb Money" Indicator/ weekly

Click Here, or on the image, to see a larger, undistorted image.


The "Smart Money" indicator is shown in figure 2. The "smart money" indicator is a composite of the following data: 1) public to specialist short ratio; 2) specialist short to total short ratio; 3) SP100 option traders. The Smart Money indicator is neutral.

Figure 2. "Smart Money" Indicator/ weekly

Click Here, or on the image, to see a larger, undistorted image.


Figure 3 is a weekly chart of the S&P500 with the InsiderScore "entire market" value in the lower panel. From the InsiderScore weekly report we get the following two insights: 1) S&P500 weekly score [[i.e., the rate of "insider buying": normxxx]] fell to a 30 month low; 2) insider buyers are not showing the conviction that sellers are.

Figure 3. InsiderScore Entire Market/ weekly

Click Here, or on the image, to see a larger, undistorted image.


Figure 4 is a daily chart of the S&P500 with the amount of assets in the Rydex Money Market Fund in the lower panel. When the money market fund is flush with cash, one can assume that the Rydex timers (like market participants in general) are fearful of market losses. From a contrarian perspective, those are good buying opportunities. When the amount of assets are low (as now), these market timers are all in; one should be on the lookout for market tops. There is little buying power left. As of Friday's close, assets in the money market fund are just off the lowest point of the year, seen last week.

Figure 4. Rydex Money Market/ daily

Click Here, or on the image, to see a larger, undistorted image.

Saturday, November 28, 2009

While You Were Sleeping…

Bill Cara's Morning Call (Blog)
Click here for a link to ORIGINAL article:

By Bill Cara | 27 November 2009

[6:00am ET] While America was enjoying their Thanksgiving Day holiday, the rest of the world was at work selling stock. The headlines today will put the blame on (i) Dubai's financial troubles, (ii) Japan's economic predicament, (iii) the tumbling oil price, (iv) U.S. Dollar struggles and soaring gold, and/or (v) whatever words are felt needed to gain readership. What Americans will not be told is that the 'special loans' departments at Humungous Bank & Broker (HB&B) are working around the clock to "protect the assets of the bank".

News Flash

In other words, while Americans yesterday were enjoying their game of football and planning their Black Friday shopping day, they should have been focused on a different game, the biggest game— where fantasy is being matched against reality— the one that resulted in Black Monday 1987. Yesterday, I opined that HB&B's collapsing share prices was "serious". That word had meaning. To follow up, I can now report that the shares of HSBC, the western world's biggest bank, plunged -7.59% in Hong Kong (see ticker 5 on the Hang Seng Exchange). The shares of the biggest bank, Industrial and Commercial Bank of China (referred to as ICBC or ticker 1398 on the Hang Seng) dropped -5.3%.

Yesterday, I wrote, "Banks from all over the world, everywhere I look early this morning, from Australia, China and Hong Kong, India, Greece, Italy, Portugal, Spain, France, Germany, UK, Ireland, and Russia, are watching their share prices pull down equity market indexes. This is serious". I went on to tell you that "over the past four weeks on the NYSE, the Financials (XLF) are the worst performing sector" and that in the past ten trading days, the shares of JP Morgan (JPM), UBS (UBS), Morgan Stanley (MS) and Goldman Sachs (GS) "have fallen between -5% and -7% each".

I didn't pull any punches when I told you what I really think:
"So the big question is why are traders dumping their bank stocks? I suspect it's because Pinocchio's nose can only grow so long. You asked: 'Where's the Bull in these banks'? There's your answer. The bank hype in the 'run-up' has been mind-boggling. The reality is quite different… It seems no one who ventures onto the stage at Tout TV will talk about the negative yield of U.S. T-Bills, but the credit system is a mess [[and growing increasingly worse so: normxxx]].

"Credit is not being extended and now, in letters to prime customers in many countries, borrowing rates are starting to be lifted. The banks say 'their costs are rising'. Isn't that interesting! … From a wider view, traders suspect there will soon be more banks like Lehman unless governments continue to save them, and with gold now almost $1200 per ounce, how much more money printing can go on? … You know; even Pinocchio dreamt of becoming a real boy. Alas, in our world it is time everyone face the truth."
With one day added to the clock, I will repeat yesterday's closing remarks: "Many of you were indulging yesterday, hoping to trim back today. Remember; the market is us".
Is there hope your portfolio will make it intact through the year-end holidays? Judging from the post-opening reaction in Europe today, that may just be a possibility. After a razor sharp lower opening gap and knee-jerk response from the Interventionists, the UK and western European equity markets are holding flat at 5:45am ET. My monitor is presently showing Royal Bank of Scotland and HSBC have been goosed +4.47% and +2.44%.

So you can hope. Isn't that all you have at this point?

What you need to pray for is yet more international central bank money printing to: (i) buy up a large portion of Dubai's $60 billion defaulting debt, (ii) give support to Japan's crisis-ridden exporters, (iii) allow HB&B friends & family to lift the oil price by 8 to 10% despite the fact there is currently a glut of supply, (iv) purchase the record offering of Treasury debt being issued this week so that the Fed (i.e., the U.S. taxpayer) doesn't have to do it, and (v) provide funding for miscellaneous purposes like the U.S. state government defaults, $900 billion for U.S. healthcare "reform", benefits and emergency bail-outs to 9 million or so desperate Americans, and on and on. That should patch up the cracks in your Super Bowl.

Isn't it interesting that just ten months into the White House, America's most popular ever president is standing today in the polls at 48%, and plunging, while his "Tim will be terrific" Treasury Secretary Geithner is now openly exchanging personal attacks with his critics during Congressional testimony, and pundits are demanding his resignation, to be replaced by yet another Teflon Bankster from Wall Street. Is Wall Street the Yellow Brick Road? Gold this morning is down -$24. Were the goldbugs the last ones to leave the dance floor or will the music continue?

My, this can get ugly. I have never seen anything like this.

For the past couple weeks, I have posted S&P 500 support and resistance levels. You have to respect those levels. Almost three weeks ago I opined, "Same parameters [as a week earlier] hold for next week; S&P over 1080, say, is a caution signal for shorts, while, on the other hand, breaking below the early October intra-day low of 1019 means the Bulls should pull in their horns". The 52-week high is 1113.69 and the index is now at 1110.63, which is just one-third of one percent from the Bull market cycle high. Was that the peak? If the S&P drops -10% from here, will the support hold, or is this market set up now for a repeat of October 19, 1987? If the level drops below 1080, will the Bulls still cling to positions, hoping for more Intervention?

Today will be interesting; but I suspect the Monday return of so many traders will be even more so.

CTA Trading Desk Report

A few short notes on the holiday shortened trading session;

• Didn't the Dubai news hit the news wires Wednesday morning?
60 billion may not sound like much in these days of trillion dollar annual budget deficits, but with 100s of trillion of derivatives floating around, a small pebble can cause a lot of ripples. Remember that the massive sell off in 1998 on the Russian debt default led to counter party problems on transactions with Long Term Capital Management— far removed from the scene.
• The Plunge Protection Team (PPT) must have been on holiday, too; otherwise they definitely would have been operating in the market today, lending support to a wobbly market on the biggest shopping day of the year.
• Did the S&P Dec future really rally
+31 points off the bottom with the declines leading advances by nearly 6 to 1 at the closing bell?
• Mr. Market has a long memory, and
1080 on the S&P stills remains the battle line for Bulls to defend.
• Gold (GLD
-1.47%) and the S&P (SPX -1.72%) traded in tandem today, with precious metals looking vulnerable if equities turn south.
• Although Bulls are probably patting themselves on the back with
'crisis averted', things could quickly get out of hand if any feeble up-tick Monday is met by formidable selling that undercuts today's low. The market advance has gotten very narrow in recent weeks, momentum divergences abound, and fundamentals are not yet supportive of another large up-leg.
• After last year's debacle, money managers may be quick to lock in profits if any other sovereign wealth fund happens to expect similar debt leniency.
Tighten up stops; Bulls and Bears make money, pigs get slaughtered.


Have Great Weekend.

Friday, November 27, 2009

Be Alert For Tanks / Third Quarter Earnings

Alert For Tanks
Click here for a link to complete edited article:

By John P. Hussman, Ph.D. | 27 November 2009
All rights reserved and actively enforced.


Last week, the Mortgage Bankers Association released the most comprehensive report available on third quarter delinquencies. Here is a summary of points from that report:

"The delinquency rate for mortgage loans on one-to-four residential properties rose to a seasonally adjusted rate of 9.64% percent of all loans outstanding as of the end of the third quarter of 2009. The delinquency rate breaks the record set [only] last quarter. The records are based on MBA data dating back to 1972. The combined percentage of loans in foreclosure or at least one payment past due was 14.41% on a non-seasonally adjusted basis, the highest ever recorded in the MBA delinquency survey.

"Job losses continue to increase and drive up delinquencies and foreclosures because mortgages are paid with paychecks,
not percentage point increases in GDP. Over the last year, we have seen the ranks of the unemployed increase by about 5.5 million people, increasing the number of seriously delinquent loans by almost 2 million loans and increasing the rate of new foreclosures (on a quarterly basis) from 1.07 percent to 1.42 percent," said Jay Brinkmann, MBA's Chief Economist.

"Prime fixed-rate loans continue to represent the largest share of foreclosures started and the biggest driver of the increase in foreclosures. The foreclosure numbers for prime fixed-rate loans will get worse because those loans represented
54 percent of the quarterly increase in loans 90 days or more past due but not yet in foreclosure. The performance of prime adjustable rate loans, which include pay-option ARMs in the MBA survey, continue to deteriorate with the foreclosure rate on those loans for the first time exceeding the rate for subprime fixed-rate loans.

"The outlook is that
delinquency rates and foreclosure rates will continue to worsen before they improve. The seriously delinquent rate, the non-seasonally adjusted percentage of loans that are 90 days or more delinquent, or in the process of foreclosure, was up from both last quarter and from last year. Compared with last quarter, the rate increased 82 basis points for prime loans (from 5.44 percent to 6.26 percent), and 216 basis points for subprime loans (from 26.52 percent to 28.68 percent)."

As I noted a couple of weeks ago in The Second Wave Begins, we are now largely beyond the peak of the sub-prime mortgage crisis, and have just begun the second wave of Alt-A and Option-ARM resets. That's important, because what we saw in the third quarter, then, was still part of the relatively tame and predictable March-November 2009 lull in the reset schedule. In that context, the surge in delinquencies and foreclosures on prime fixed-rate loans is disturbing, because that wasn't even part of the reset equation, and represents a relatively pure effect of the weakness in employment conditions.

Now, we face a coupling of those weak employment conditions with a mountain of adjustable resets, on mortgages that have to-date been subject to low teaser rates, interest-only payments, and other 'optional' payment features (hence the "Option" in Option-ARM). These are precisely the mortgages that were written at the height of the housing bubble, and therefore undoubtedly carry the highest loan-to-value ratios.

The inevitability of profound credit losses here is unnervingly similar to the inevitability of profound losses following the dot-com bubble. In that event, it wasn't just that people were excited about dot-com stocks in a way that might or might not have worked out depending on how fast the economy grew. Rather, it was a structural issue that related to the dot-com industry itself— those bubble investments couldn't have worked out in a competitive economy, because market capitalizations were completely out of line with what could possibly be sustained in an industry that had virtually no cost to competitive entry. If you understood how profits evolve in a perfectly competitive market with low product differentiation, you understood that profits would not accrue to the majority of those companies even if the economy and the internet itself grew exponentially.

In the current situation, the assumption that the credit crisis is "behind us" is completely out of line with what possibly could result from the marriage of deep employment losses and an onerous reset schedule on mortgages that have extremely high loan-to-value ratios. A major second wave of mortgage losses isn't a question of whether the economy will post a positive GDP print this quarter or next. Rather, it is a structural feature of the debt market that is baked into the cake because of how the mortgages were designed and issued in the first place.

If one wishes to monitor the markets for emerging signs of risk, several areas are worth watching. First, the FDIC should release its most current Quarterly Banking Profile later this week. That report will be an interesting gauge of emerging credit stress. Yet even here, a lot of the pressure to properly account for losses on off-balance sheet entities and so forth won't start until next year. In the meantime, credit spreads in general, and credit-default swaps on individual companies may bear closer attention in the weeks ahead. Finally, given the enormous pressure there may be to put a good face on increasingly bad assets, the departure of the chief financial officer of at least one major banking institution, which would not surprise me early next year, might be a sign that all hell could break loose.

The past decade has been largely the experience of watching tanks rolling over a hilltop to attack the villagers celebrating below. Repeatedly, one could observe these huge objects rolling over the horizon, with an ominous knowledge that things would not work out well. But repeatedly, nobody cared as long as it looked like there might be a little punch left in the bowl. As a result, long-term investors in the S&P 500 have achieved negative total returns over a full decade. These negative returns, of course, were also predictable at the time, based on our standard methodology of applying a range of terminal multiples to an S&P 500 earnings profile that has— aside from the recent collapse— maintained a well-behaved growth channel for the better part of a century.

From my perspective, we are again at the point where we should be alert for tanks. We already know that stocks are priced to deliver a 10-year total return in the area of 6.1% annually— among the lowest levels observed in history except for the period since the late-1990's (which despite periodic advances has ultimately not worked out well for investors). We are already observing evidence of weak sponsorship from a volume perspective and growing non-confirmations of recent highs from the standpoint of market internals. The cumulative tally of 'surprises' in economic reports (a metric we credit to Bridgewater, which Bill Hester adapted here), has also turned down decidedly. Though the historical correlation is not always as strong as it has been during the recent downturn, shifts in economic surprises have tended to lead market turns in recent years.

Still, with market internals mixed but not clearly collapsing, prices strenuously overbought but still achieving marginal new highs, and valuations unfavorable but not as extreme as they were in 2000 or 2007, investors may be convinced that there is still a little bit of punch in the bowl. We can't argue with that too strongly, and have been trading in (on market weakness) and out (on market strength) of a modest positive market exposure in recent weeks (to diversify our position and allow for two very different potential states of the world). We're just keeping our risk very close to the vest.

In short, we have to allow for the potential for further speculation, and we can't ignore the day-to-day charts showing several market indices near 52-week highs. But we are also at the point where we can look right over the top of the monitor, and see the tanks a-coming.

Market Climate

As noted above, the Market Climate for stocks last week was characterized by unfavorable valuations and mixed market action— with several major indices achieving new 52-week highs, but weak volume sponsorship, lack of confirmation from several indices and market breadth, and still strenuous overbought conditions from an intermediate-term perspective. The Strategic Growth Fund remains largely hedged, though we are allowing for a small amount of positive exposure on weakness, and clipping that exposure on strength. Most of the day-to-day fluctuation in the Fund here is driven by variation in the performance of the stocks owned by the Fund versus the indices (the S&P 500, Russell 2000 and Nasdaq 100) we use to hedge. That fluctuation can be positive or negative day-to-day, but the performance differential from our stock selection has been a net contributor to Fund returns both this year and since inception.

In bonds, the Market Climate last week was characterized by modestly unfavorable yield levels and modestly favorable yield pressures. The Fund made a very distinct move away from TIPS on the strength of recent weeks, as real yields on many issues moved to negative levels. The Fund is also flat foreign currencies, having closed those positions out on recent strength, and has only about 1% of assets in precious metals shares and about 4% of assets in utility shares. The primary risk carried by the Fund currently is a modest amount of interest rate exposure, where the Fund carries an average duration of about 3 years, mostly in intermediate-term Treasury securities. As usual, we tend to be opportunistic in establishing investment positions, so to the extent that we observe decided weakness in foreign currencies, precious metals or TIPS (all of which would most probably be driven by a shift toward risk-aversion in response to fresh credit concerns), I would expect that we would re-establish exposure in these areas. For now, we are maintaining a comfortable but limited amount of interest rate exposure, and are prepared to respond to opportunities as they arise.

… … … … … .

Three Observations on Third Quarter Earnings
Click here for a link to complete article:

By William Hester, CFA | November 2009
All rights reserved and actively enforced.

The bulk of third-quarter earnings are now in. Here are three observations that have been widely discussed: (1) Earnings fell about 15 percent from this time last year, which was better than expected at the beginning of the reporting season. (2) More than 80 percent of companies announced earnings above analyst's expectations, but only about 55 percent of companies beat on revenue expectations. (3) The bulk of the earnings declines were delivered by economically sensitive groups like materials and energy stocks, while the financials posted the largest gains in operating earnings. Here are three more observations which have received less attention: (1) Some amount of investor selectivity or "discretion" is returning to the stock market. (2) Higher quality companies may be staging a comeback. (3) The earnings surprise beat rate may be useful, but not in a way that you might expect.

It's important to recognize that analyst estimates for say, year-ahead earnings, are almost always far too optimistic. As the actual reporting period draws closer, analyst estimates for various companies are gradually cut (as was the case prior to the third quarter reports). So when we say that reported earnings were generally above analyst expectations last quarter, that fact comes with the caveat that those expectations were the whittled-down expectations that existed just before the actual earnings were announced. Of course, the other caveat is that an earnings report qualifies as an upward surprise even if it surpasses analyst expectations by just a penny, which is common. For that reason, the average earnings surprise or disappointment prompts the market to reward or punish the stock price only by something on the order of 2% or less over a given quarter.

Before talking about the comeback of investor discretion, it's important to take a quick look at one example of investors' lack of discretion earlier this year. As the market moved higher this year, some observers claimed that companies were reporting results that were better than expected, and these results were fueling the stock-market recovery. But when you look at the data, this argument isn't persuasive.

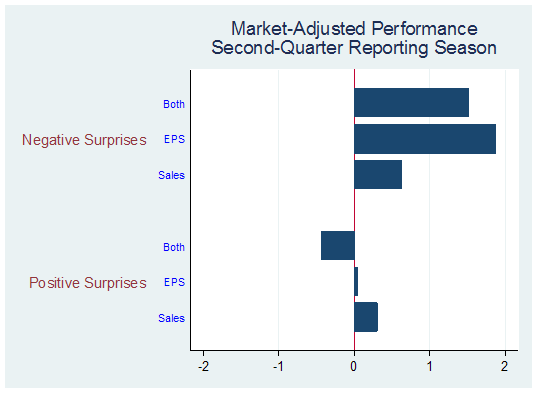
The bar chart below shows the average net performance of stocks in different groups. The three bars on the top show the net performance of stocks that reported negative surprises in both earnings and sales, and then in earnings and in sales, each. The three bars on the bottom show the net performance of stocks using the same metrics, but include only those that surpassed estimates. The return periods run between each company's reporting dates. So, for example, Alcoa's returns run from July 8th through October 7th of this year, following the company's second-quarter report. The returns are market adjusted (versus the return of the S&P 500 equal-weighted index), and then averaged. Generating returns in this way allows us to focus on what investors are responding to on a company-by-company basis in the periods following the release of new information.


Although top-line sales growth is getting more attention recently, typically investors are more sensitive to earnings surprises. And as the graph above shows, investors did respond to earnings, just not in the way that is typical. Companies that announce earnings surprises tend to outperform companies that miss estimates, on average. But during the second quarter reporting season, that trend was mostly reversed. Companies that missed estimates performed best. And although it's not shown, the performance during the first quarter reporting season was similar, especially in regard to earnings surprises. Companies that announced positive surprises trailed the market by about 2 percentage points, on average. Those companies that missed estimates outperformed the market by about 2 percentage points.

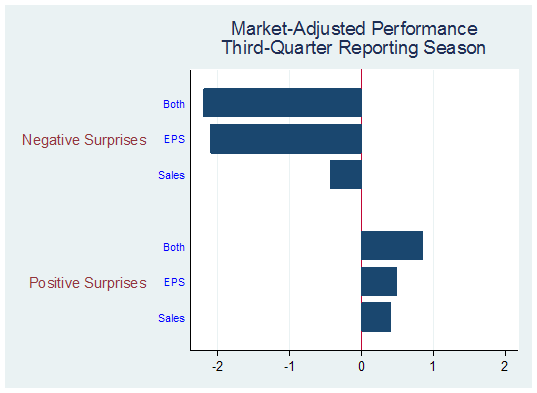
The next chart updates the performance of stocks during the third-quarter earnings reporting season. Here, company performance was measured from the company's most recent earnings announcement date through Friday. You can see that there are some signs that discretion is coming back into the market. Companies that reported positive surprises have outperformed the market— and the better the news, the better the performance has been. Companies that reported positive earnings surprises are doing better than companies that reported only positive sales surprises. And companies that have reported better-than-expected results in both measures have outperformed companies that surprised on just one metric.


The rally up through late summer was less about improving corporate performance than it was about reversion to the mean and beta chasing. Investors mostly indiscriminately bought highly cyclical and highly levered stocks, partly because some of these stocks were priced for potential bankruptcy and partly based on the view that the economy will recover strongly next year. More recently, investors are showing a bit more discretion, by seeking out companies that are producing sales and earnings surprises in a very challenging economic environment.

A Turn for High Quality Stocks?

The beta-chasing pursued by investors this year created stark differences in the performance among individual stocks. One of the clearest places to see this was the difference in performance between lower-ranked companies based on measures of quality (mostly the dependability of operating results) and higher-ranked companies. High-quality companies have returned about half what the equal-weighted S&P 500 Index has returned this year while the very lowest quality companies have returned almost 2.5 times the index. As other analysts such as Jeremy Grantham and Mark Hulbert have pointed out, this relative difference in performance of the two groups is off the charts when you compare it to similar market rebounds in the past.

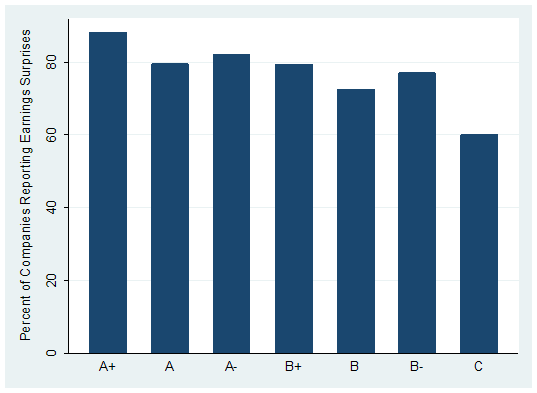
There may be a shift taking place. Since the beginning of the third-quarter earnings reporting season the average high quality stock has returned 7.5 percent, versus 6.4 percent and 5.9 percent, for mid-quality and lower-quality stocks, respectively. Now, that's just a blip on the relative performance graph compared to the extent that low quality has outperformed this year. But it's worth noting because if investors are being more sensitive to actual company operating performance, then the trend in relative performance between high and low quality companies may continue. The graph below shows the rate at which companies beat their third-quarter earnings estimates based on S&P's quality rating. Nearly 90 percent of higher quality companies beat their earnings estimates, while only about 60 percent of low quality companies beat their earnings estimates. If economic and earnings growth over the next few quarters turns out to be lumpier than is currently forecasted, then high quality companies will likely be in a better position to produce more favorable results versus expectations. If investors continue to show discretion in choosing companies with favorable operating performance relative to expectations, this would benefit higher quality companies.


Beat Rates

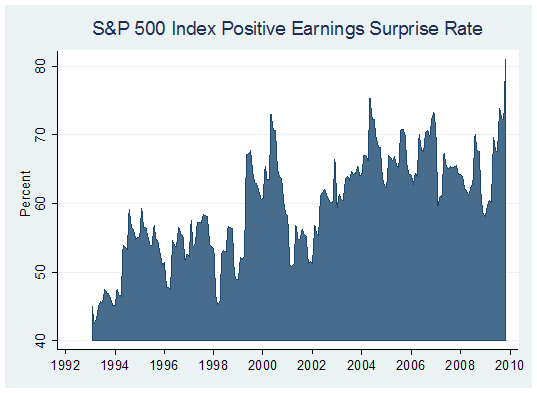
About 80 percent of the companies reporting earnings in the third quarter beat analyst's estimates. That's a record, according to Bloomberg's record keeping of positive earnings surprises, which began in 1993. We'll use this data to attempt to answer a couple of important questions. Is there value in tracking the earnings surprise rate? Can investors expect the market to move higher when the surprise rate rises? Is there information in a declining earnings surprise rate?

The graph below shows the Positive Earnings Surprise Rate for the S&P 500 Index going back to 1993, using monthly data. As you can see, there has been a secular rise in the surprise rate. Over time companies have caught on that investors prefer positive surprises to negative surprises. That may be part of the reason for "one penny" earnings beats, which are relatively common. The tendency for analysts to lower earnings expectations as the actual reporting quarter approaches is another contributor to the general secular rise in the beat rate. If these practices continue, at some point we'll need to drop the word 'surprise' from the earnings surprise moniker.


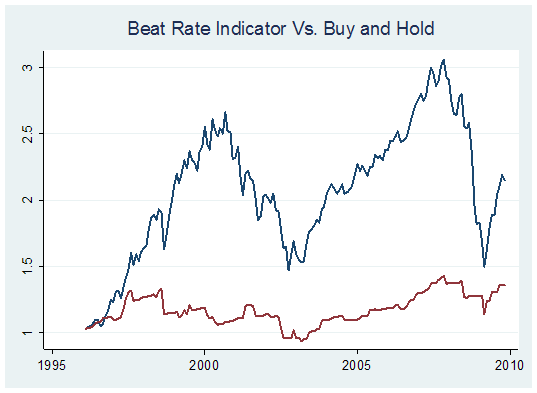
But until then, and considering that the earnings surprise beat rate has become so widely followed— and often used as bullish argument— it's worth looking at whether it's a valuable indicator. Often the clearest way to see if an indicator is useful is to test it as if it were a trading strategy. When this is done with the earnings surprise line you get very mixed results. As you can see by the graph above, absolute levels don't work since the index has drifted up over the 15-year period. Information gleaned from simple look-back strategies is also mostly unhelpful. The graph below plots the return of a strategy where you invest in the market when the surprise line rises from the previous month, while earning the risk-free rate during periods where the surprise line fell from the prior period.


It's clear that the level and short term increases and decreases in the surprise rate aren't particularly useful. This is partly because the beat rate data is fairly volatile from month to month. Even so, we can ask a slightly different question.

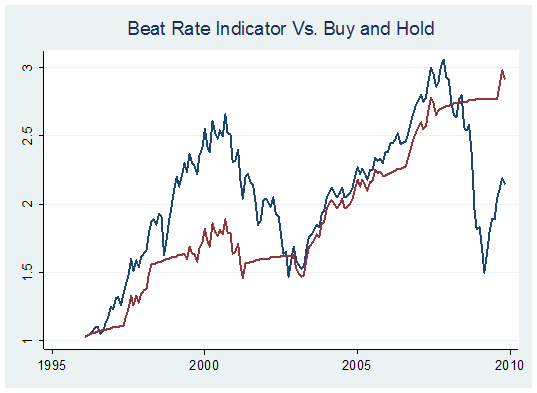
Given that the earnings beat rate seems to have moved up gradually over time, what happens when— despite this trend— companies fall short of the recent trend, either by a significant amount or over an extended period of time? We can pick up either pronounced or sustained disappointments in the beat rate by taking a 12-month moving average of the beat rate and comparing it to the 24-month moving average. The red line in the chart below shows the investment return from avoiding periods when that 12-month average fell short of the 24-month average.


Since the beat rate has generally trended up over time, the 12-month average has generally been above the 24-month average, so this version of the indicator has the tendency to stay invested. As you can see, the earnings surprise rate was above its moving average during a portion of the late 1990's rally and the bulk of the 2003 to 2007 rally. But what is most impressive is how much of the market's losses coincided with the surprise rate falling below its moving average, which happened convincingly in 2001 and again in 2007. By avoiding market risk when earnings surprises fell below their 24-month moving average, the maximum drawdown using this simple metric was only about half of what a buy-and-hold strategy experienced.

So, the surprise rate is mostly ineffective when measured on an absolute level and also when used with shorter-term comparisons. But there may be some information in significant or sustained failures of the beat rate to keep up with its recent history (e.g. its 24-month average). With the current beat rate at a record high, the current rate may be difficult to sustain in the months ahead (based on typical past trends). Investors may want to watch the rate of that descent.

Here are a few important caveats. While disappointments in the beat rate are important, this indicator leaves out too much information to be used as the sole determinant of an investment position. There's no valuation component, no market action or price trend measures, data availability is mostly limited to two bear markets induced by dramatic profit recessions, and it wasn't tested in a way that an investment model should be tested (split samples with a holdout data set).

While the indicator turned down before the major losses of the most recent bear market, it didn't turn negative in the 2000-2002 bear market until about half of the losses were already sustained. Even so, since the surprise rate is an indicator that has gained in popularity, it is worth highlighting its strengths. The primary strength of the indicator, based on available data, is that becoming more defensive when the surprise rate is declining rapidly may be helpful in mitigating risk.

Thursday, November 26, 2009

Where The Crisis Came From

Where The Crisis Came From

By Robert G. Wilmers, WP | 27 July 2009

Over the past three decades, there has been a sea change in the way that credit is extended in America, creating the problems— and the need for reforms— that we face today. At the heart of the financial crisis lie the complex, opaque derivative securities created not by traditional Main Street banks, but by Wall Street— with the passive complicity of regulators. Wall Street created, originated, and 'sold' an alphabet soup of derivative securities, and it was such synthetic instruments— not traditional mortgage loans, small-business loans or other standard/conventional lending originated by banks— that unleashed a flood of credit [[seeking investors, and not the other way around, as traditional: normxxx]], created a vast excess of housing, weakened the capital structure of the banking industry and undermined popular confidence in banks.

In previous generations, home buyers obtained mortgages and other loans from local, or Main Street, banks, which typically held those loans until they were fully repaid— and therefore had an interest in making loans that borrowers could afford. But then Wall Street started slicing, dicing and packaging mortgages into 'bundles' that served as the basis for 'bonds' sold in the securities markets. Traditional bank deposits were no longer the primary funding source for credit. Instead, loans were being financed by the [[much more risk tolerant: normxxx]] capital markets and packaged and sold by Wall Street. Mortgages were originated by one firm, packaged by another, sold by a third and serviced by yet another— but none of them worried about whether the mortgages would be repaid, because they didn't hold the loans on their books. [[In their defense, it was assumed that since "housing prices could only go up", these mortgages would be 'refinanced', should the 'homeowner' find himself unable to pay the 'reset' mortgage interest rate [[i.e., any rate higher than the introductory 'teaser' rate: normxxx]]. In effect, everyone including the homeowner was basing the housing purchase investment decision on the expectation that the good times would never end! : normxxx]]

Securitized debt grew nearly 50-fold from 1980 to 2000— compared with a mere 3.7-fold increase for bank loans. In 1998, traditional bank lending was surpassed by securitized debt for the first time. By the end of 2007, Wall Street accounted for two-thirds of all private U.S. debt. This growing market for synthetic mortgage-backed securities inundated the country with credit that, combined with historically low interest rates and exotic new mortgage products [[curtesy of Alan Greenspan: normxxx]], fueled the housing bubble and turned our financial markets into a virtual casino. In the collapse that followed, billions of dollars' worth of mortgage-backed securities were written off.

But the public continues to think of banks as the primary source of credit— and to blame banks for the credit crunch. Public officials contribute to the confusion by criticizing banks— while allowing Wall Street to operate this "shadow banking industry," which exists outside the standards for safety and soundness that apply to banks and without obligation to make clear the extent of such firms' debt, leverage, capital or reserves. Many Wall Street firms played significant and contributory roles in the evolution of this crisis.

Wall Street's most prominent investment bank, Goldman Sachs, historically the industry leader, was at the forefront of the creation, origination and sales of derivative securities— and also spent $40.6 million on lobbying and campaign contributions from 1998 to 2008. In 2008 alone, Goldman spent $8.97 million in this way— almost 11 percent more than the Financial Services Roundtable, a trade organization that represents 150 top financial institutions. The conversion of the Goldman Sachs investment bank into a giant hedge fund went unchecked by legislators and regulators [[who, in fact, actually facilitated this change by largely eliminating any remaining regulatory laws which impeded the investment behemoths (largely put into place to protect us from a repeat of the 1930's calamity): normxxx]], despite constituting a radical change to our financial system. And it has since received billions upon billions in taxpayer bailout funding to keep it alive.

By contrast, consider how regulators treat Main Street banks compared with the way they deal with this highly 'connected' investment bank: When M&T Bank applied for regulatory approval to acquire a modest-size bank in Utica, N.Y., it took 10 weeks and a promise to divest three branches before permission was granted. On the other hand, when the Goldman Sachs Wall Street investment house decided to seek a commercial bank charter in the midst of the financial storm, permission was granted in less than a week. By obtaining this charter, Goldman Sachs received access to the Federal Reserve Discount Window and the Federal Deposit Insurance Corp., which has long been funded by dues from thousands of community-based banks across the United States— and which has since guaranteed $28 billion of Goldman Sachs' debt securities. That's equal to 10 percent of all funds guaranteed under the government's Temporary Liquidity Guarantee Program.

The same could be said of many other large financial firms that are also big spenders in Washington. The 10 largest recipients of federal Troubled Assets Relief Program funds— including two Wall Street investment banks and three other, non-bank institutions that participated— spent $82.4 million on lobbying and campaign contributions in 2008 and $523.6 million over the past 10 years. This sort of behavior is simply wrong. Corporate leaders have an obligation to set the right tone— a moral tone— lest public confidence in our private enterprise system completely erode.

Also, we must restore the balance of regulatory oversight between commercial banks and other parts of the financial services industry. We should do so not only to be fair to banks but because the nation's ailments won't be cured unless solutions are directed at the entire financial system, not just the one-third of it [[that 'supports our legislators': normxxx]].

The writer is chairman and chief executive of M&T Bank, one of the 20 largest U.S. bank holding companies.

Saturday, November 21, 2009

More Gloom And Doom From Our French Friends

More Gloom And Doom From Our French Friends.
Click here for a link to ORIGINAL article:

By Public Announcement Geab N°39, November 16, 2009 — 19 November 2009

GEAB N°39: Global systemic crisis! States faced with three brutal options in 2010(!): inflation, high taxation or default!

[ Normxxx Here: Note:  These are the same people who absolutely declared— with no uncertainty or caveats— that the US dollar and UK pound would be toast by end of summer 2009! They are notorious Francophiles and Anglophobes (the latter to include Americans). But, it is an alternative view, and they are very often correct.  ]

As 'anticipated' by LEAP/E2020 last February [[not quite! : normxxx]], in the absence of major reappraisal of the international monetary order, the world is now entering the phase of geopolitical dislocation of the global systemic crisis. In 2010, as protectionism and the economic and social depression gain momentum, a large number of States will be compelled to choose between three brutal options: inflation, high taxation or defaulting on their debt. A growing number of countries (USA, United Kingdom, Euroland1, Japan, China2,…) have exhausted their budgetary and monetary 'cartridges' in the 2008/2009 financial crisis and are now left with no other alternative. [[But, never underestimate the power of the human mind (especially those of politicians) to come up with yet "newer" solutions… and just 'muddle through'.: normxxx]]

Nevertheless, out of ideological reflex or in an attempt to avoid by any means having to make such painful choices, they will continue to try to launch further 'new' stimulus plans (under different names) even though it is now clear that the huge public effort made in the past months to boost the economy is having no impact on the private sector. [[I suspect that that is a gross exaggeration. Much less than hoped for, certainly; but way more than in similar periods since 1933 (when FDR ushered in a whirlwind of programs, which nonetheless was puny by today's standards).: normxxx]] Indeed the consumer-as-we-knew-him in the past decades is dead, with no hope of resurrection3.

Knowing that nearly 30 percent of Western countries' economies are now made of « economic zombies » (financial institutions, companies and even entire States, whose signs of life are only due to the occasional liquidity injections of the central banks), it is possible to confirm the inevitability of the "impossible recovery"4. Internationally and socially (i.e., within each country), the « everyman for himself » rule is beginning to prevail, as well as the general impoverishment of the erstwhile "First World" of rich Western countries, with the United States leading the way. In fact the West is being [[deliberately[!?!]: normxxx]] scuttled by leaders unable to face the reality of a 'post-crisis world', who keep resorting to methods from yesterday's world [[in a near desperate attempt to at least maintain "relative position" in a post-crisis world: normxxx]] despite the proved insufficiency/ineffectiveness of such methods.

In this 39th issue of the GEAB, our team has therefore chosen to focus our anticipations/expectations[!?!] on general developments ahead in 2010, a year when key states will see their choices restricted to three brutal options: inflation, high taxation or default, which they will struggle in vain to escape. Knowing that one of the reasons why 'stimulus plans' are doomed to fail is that the consumer-as-we-knew-him in the past thirty years is dead [[but, as Mark Twain so famously remarked, "the rumors of my demise have been greatly exaggerated," I believe that the wake in progress for the 'consumer' may yet prove premature.: normxxx]], we analyze this phenomenon in this issue of the GEAB, as well as fallout for companies, and for the marketing and advertizing businesses. In the field of geopolitics, we present a number of LEAP/E2020 anticipations regarding Turkey by 2015 with regards to both NATO and the EU. Of course, we also present our usual monthly recommendations, as well as the results of the last GlobalEurometre survey.


Evolution of German federal budget (1991— 2010) (estimates in 2009 and 2010 do not include Angela Merkel's recently announced tax cut plan)— Source: Financial Times / Thomson Reuters, 11/02/2009

But Yesterday's Recipes Have No Effect On The Global Systemic Crisis

The only chance for the states to escape the three brutal options noted above would be that either consumption resumes [[in a big way: normxxx]] or the private sector starts investing again. But in the absence of one or the other major positive dynamic, States will have no other alternative in 2010 than to raise taxes to match their huge public deficits, let inflation soar to diminish the relative weight of their debt, and/or 'file for bankruptcy'. Some of these countries (the US, UK, Ireland, Argentina, Latvia, or even Spain, Turkey, Dubai or Japan) could be confronting two, or even all three, options at the same time.

Trends regarding consumption and investment are extremely negative. The consumer is now 'incited' to save money, pay back his debt and, more generally, reject (willingly or not) the 'Western model of consumption' of the past thirty years5 due to which growth, in the US and UK in particular, became nearly entirely dependent on him6. Meanwhile, companies, due to their lack of foreward visibility (to be positive) or to actual negative forecasts, are cutting back on investment, a situation only made worse by new and more onerous banking credit restrictions [[as the banks desperately try to hold on to/build on to their remaining stock of capital: normxxx]]7.

Public investment also is reaching limits: it will be impossible to significantly extend or renew previous stimulus plans without excessively increasing public deficits and then being faced, at the end of 2010, with at least two of the three brutal options8. The states are indeed exposed to increasing pressure (general public, supervisory bodies, private investors)9 to balance their bad, i.e., dangerous, budgets. In other words, public investment in 2010/2011 is doomed to shrink rapidly.

"Foreign demand" is completely saturated: everyone wants to export in order to find abroad that greedy consumer or investing company that is no longer to be found at home. The great myth being that Asia, and China in particular, will provide for this « new Western-style consumer ». Besides the fact that many will be called but few will be chosen among non-Chinese or non-Asian to enjoy the region's market, it would be an underestimation of the systemic nature of the global crisis to imagine that this 'new' consumer will be as greedy as the now moribund Western consumer. The luxury industry and its current woes in Asia clearly illustrate this situation.


Comparative Evolution Of UK GDP During Each Recession Since The 1930s Crisis (In Months, From Official Start Of Each Recession)— SOURCE— National Institute Of Economic Review, 10/2009

So what's left?

« Zombie-Economy » Now Accounts For A Considerable Part Of The Global Economy.

Central banks continue to supply financial markets with liquidity, hoping that at some point their huge quantitative effort will result in some qualitative surge in the real economy. In the US and UK particularly, as they continue to pretend that the crisis does not reflect a general problem of insolvency (of banks, consumers, public organizations and companies), they "wait for Godot" and create the conditions for soaring inflation, and collapsing currencies and public money. States unflinchingly continue to bear the consequences of banks' mistakes, while still slavishly following their bankers' advice. Thus they have built up a debt of at first unreasonable and then intolerable proportions, and now they are on the verge of drastically cutting public spending10 and significantly increasing taxes in an attempt to avoid bankruptcy11.

« Economic zombies »12, private and public ones, now account for a large part of Western and Chinese economies: objectively defaulting states (like the UK or US) which no one dares technically declare as such; bankrupt companies still allowed to run for fear of increasing unemployment otherwise13; insolvent banks14 whose accounting rules are modified to hide the worthlessness of their assets, to postpone their inevitable implosion15. Financial markets are going up thanks to liquidity graciously offered by central banks16 eager to give back to the consumer/grant-holder a felling of wealth in the hope that he will start being himself again and consume, when in fact all categories of assets17, such as gold for instance, are also going up (even faster in most cases), clearly indicating that inflation has in fact returned.

Unemployed people are piling up by the dozens of millions in and out of official figures, suggesting that 2010 will be a tough year socially-speaking, placed under the sign of protectionism to save jobs by any means (i.e., by tariffs, environmental or sanitary barriers, or by simple competitive devaluations of currencies), while governments wonder how much longer they can take the global cost of so much unemployment when no recovery is in sight18. [[While over all looms the specter of the '30s: gross overcapacity of manufacturing facilities worldwide, but especially in China.: normxxx]]


Evolution of unemployment rate in the Euroland and in the US (1991— 2009)— Sources: Eurostat, Bureau of Labour statistics, Morgan Stanley

LEAP/E2020 wrote in February and March 2009 that, if the international monetary system was not completely reconsidered before summer 2009, the world would inevitably move towards a situation of global geopolitical dislocation, some sort of a worldwide "very great depression", centered on the collapse of yesterday's world's pillar, the US. That's where we are now19. [[They also wrote that the US dollar and the UK pound would be 'toast' by then.: normxxx]] Even 'adjusted' figures20 can no longer hide the level of deterioration of the global economic and social situation nor the descent to hell of the US economy and society.

This reality is becoming clearer and will be obvious to everyone by the beginning of the second quarter of 2010. In this GEAB N°39, as every month, our team tries to anticipate the main trends so that everyone, personally or professionally, can get ready for a difficult year in 2010, a year when yesterday's recipes will prove their insufficiency in curbing the global systemic crisis.

_________________________________
NOTES:

1Among these key countries, only Angela Merkel's Germany can still do it, and it will: indeed, the German chancellor has decided to launch a new stimulus plan based on … tax cuts. It is difficult to be more ideological and disconnected from the reality of the crisis! Germany must therefore now expect a substantial deterioration of its fiscal situation by the end of 2010… as well as significant tax increases to alleviate the fiscal debacle. According to our team, today's ideological blindness of Western leaders in tax matters is equal to that of communist leaders in the early months of 1989: no understanding whatsoever of the fact that past recipes no longer work. Just like the "good communist subject" was no longer willing to obey passively, the « good Western consumer » is no longer willing to consume actively. But no one ever said that Angela Merkel, Nicolas Sarkozy, or Barack Obama understood anything of the economy.

2China can still afford a stimulus plan, but the Chinese problem, as already analyzed by LEAP/E2020, is the time needed for a sufficient domestic demand to emerge and make up for collapsed exports. In this case, no stimulus plan in the world can « buy » this missing time, this decade, that the Chinese need in order to develop a significant domestic demand. In 2010, once the smoke-screen generated by artificially stimulated production will be dissipated, everyone will see that this production was not sold… for lack of buyers.

3This video-clip perfectly illustrates, with a lot of humour, the radical change in consumer ways currently taking place in the US.

4See GEAB N°37

5We shall develop this analysis in another chapter of this GEAB N°39.

6In 2008, household consumption accounted for 70 percent of US GDP and 64 percent of UK GDP, versus 56 percent of German GDP and 36 percent of Chinese GDP.

7Sources: MarketWatch, 11/09/2009; IrishTimes, 10/27/2009

8According to LEAP/E2020, the bitter irony of the situation lies in the fact states currently refusing to face the perspective of the three brutal options which would enable them to make their way at best amidst the three options, condemn themselves to suffer at least two of them at the same time by the end of 2010. "Taking a step back for a worst jump" so to speak.

9Because it is so unpopular, the « second » US stimulus plan [[under the current administration, but : normxxx]] in fact the third, if we take into consideration G. W. Bush's tax cut plan in 2008), is being prepared in an "undetectable" form. It will consist of a disparate set of measures that the Obama administration will avoid presenting as a single, coherent, unique 'plan' in order to conceal its true nature. In the same category, we also find the French government's « big national loan » which Nicolas Sarkozy pretends to be a long-term investment, but which Brussels will add to the French debt as a simple short-term economic stimulus plan. From 'overt' inefficient policies to 'hidden' inefficient policies… what a victory over the crisis! Sources: TheKatyCapsule, 10/22/2009

10The OECD is clear on that: to get over it, Western countries will have to proceed to drastic cuts in education, health, social programmes… Ireland, ultimate model for the same OECD, EU or IMF two years ago, is about to lead the dance: the first in its frenzy of ultra-liberal consumption, it will also be the first in applying ultra-liberal austerity. No wonder then that large demonstrations have started filling streets of the country's big cities. Sources: FinancialTimes, 09/22/2009; RTE News, 06/11/2009 [[But so far, lowly Iceland, a country about as given to 'socialistic' forms of social support as Ireland, and surely in far worse straits just a few short months ago, seems to be doing great since it snubbed the EU proscriptions for 'recovery!': normxxx]]

11Sources: EUObserver, 11/10/2009

12It is worth reading the detailed definition of a « zombie economy » as proposed by PA Consulting Group on 11/10/2009.

13Walking around North-American and European cities is a good way to realize that, though many brands are still shining to attract buyers, they are in fact the deceptive appearances of bankrupt companies kept artificially alive by means of public money or uncertain restructuring, as in the case of CIT, GM, Chrysler, Saab, Opel, Karstad, Quelle, Iberia, Alitalia, … Superficially, things would appear to be moving along normally, but in fact a disease is striking deeper and deeper into the corporate fabric, filling it with true 'zombies'. In China, the zombies are made of all those factories kept running, not thanks to customers, but to state handouts. All those « economic living deads » are the result of the gradual injection into the real economy of the USD 20,000 to 30,000 billions in 'ghost-assets', previously described in the GEAB.

14Source: Bloomberg, 11/02/2009

15The expression « zombie bank » even has its definition in Wikipedia.

16Source: Financial Times, 10/22/2009

17Except real estate.

18Knowing that each job created roughly costs USD 324,000 (according to White House figures), one may indeed wonder how much longer such inefficient policies can continue. Source: Global Economic Trend Analysis, 10/31/2009

19Those who still doubt that the current crisis is provoking a major time acceleration should read this article by Michael Klare published in TomDispatch on 10/26/2009, showing how US decline forecasts by 2025 as analyzed one year ago by the CIA are in most case already coming true… right under our noses.

20Even CNBC now mentions the fact, one extensively described in the previous GEABs. Source: CNBC, 11/09/2009

Lundi 16 Novembre 2009

ߧ

Normxxx    
______________

The contents of any third-party letters/reports above do not necessarily reflect the opinions or viewpoint of normxxx. They are provided for informational/educational purposes only.

The content of any message or post by normxxx anywhere on this site is not to be construed as constituting market or investment advice. Such is intended for educational purposes only. Individuals should always consult with their own advisors for specific investment advice.

Friday, November 13, 2009

Looking Ahead: 2010 and Beyond

[ Normxxx Here:  Remember, above all things, we are merely in the MIDDLE of a secular BEAR market that has some 10 years or so left to run!  ]

Breakfast With Dave
Looking Ahead: 2010 and Beyond


By Dave Rosenberg, Gluskin Sheff | 5 November 2009

While You Were Sleeping
• Global semi-conductor sales surged 8.2% MoM in September
• Gold glitters
• Equities rallying, commodities firming, U.S. dollar weakening
• Auto sales rev up … but still at anemic levels
• In the U.S., commercial real estate a disaster for banks
• A bounce in bankruptcies in October


It's all good. Equities are rallying, led by the emerging market space with a hefty 1.7% advance today. China is now [on a regular tear]— the longest winning streak in two months. U.S. equity futures are bid (maybe also responding some to the recent GOP gubernatorial successes— Virginia and New Jersey).

Bonds are selling off. Credit default swaps improved 20bps. The U.S. dollar is softening again as it struggles near its 50-day moving average and the reason being cited is that the Fed press statement today will acknowledge the recovery but stop short of discussing any 'exit strategy' or removal of "extended period" when it comes to discussing how long the funds rate can be expected to scale the zero line.

With the dollar soft, commodities are firming with oil breaking above $80/bbl and on its way for a third winning session in a row; the metals are following suit. Gold has broken out yet again and is up another 1% so far today as it begins to challenge the $1,100/oz mark (according to unofficial IMF estimates, the Reserve Bank of India bought gold at $1,045/oz. With the size of the purchase— 8% of annual mined production— and at that price it certainly helps establish a floor! The fact that the yellow metal is accomplishing this with ongoing deflationary developments— Euroland PPI came out for September and showed a 0.4% MoM decline and a -7.7% YoY trend— suggests that other factors are driving bullion to new bullish heights. It's called scarcity of supply relative to fiat currency.

Auto Sales Rev Up … But Still At Anemic Levels

Wow! U.S. auto sales surge 12% MoM in October, to the grand total of 10.3 million units at an annual rate, which was in line with the 'whispered' estimate. That is not a sign of strength at all. It is a sign of how horrible September was in the aftermath of the cash-for-clunker campaign. This will undoubtedly kick-start retail sales for the month but let's get a grip. At 10.3 million units, the outstanding stock of vehicles in the driveways and freeways of American is contracting. Secular changes are afoot in terms of how U.S. consumers are approaching credit, homeownership and 'discretionary' spending. Just to provide some perspective, 10.3 million units is the eighth lowest level since October 1982.

That said, we could well see a solid retail sales report for October outside of autos too— today's Wall Street Journal reports that store executives reported improved traffic and sales up 2.0% YoY (though from depressed levels a year ago); MasterCard's spending pulse index is flagging a +3.4% tally for apparel sales, which would be a 14-month high. Retailers are headed into the holiday shopping season with a subdued forecast and thus fairly lean inventories and so if these numbers are accurate, the prospect for markdowns could be limited. In fact, this was the case in the auto sector as average incentives were 12% lower than was the case a year ago.

U.S. auto sales surged 12% in September … it looks as though consumer spending is holding on.

Consumer confidence is in the doldrums, of that there is no doubt, and the job market backdrop, while better than it was earlier this year, is still in rough shape. Yet it does appear that spending is holding in and this could well still be a lagged response to all the government stimulus in the system. What does surprise us is the savings rate— the upward trend seems to have stalled out for the time being.

Commercial Real Estate A Disaster For Banks

7,771 U.S. Companies Filed For Chapter 11 Last Month

We see an article in the Investor's Business Daily citing a startling statistic that over the next 15 months, we are going to see $2 trillion of commercial mortgage debt rolling over. Rest assured that default risk will continue to rise as will the chance that we continue to see more regional bank failures. Estimates we have seen point to anywhere between $200 and $300 billion on bank-wide losses on commercial real estate loans.

Even though the delinquency rate has hit 16%, banks have thus far only written down 4% to 7% of construction loans. Losing 2.5 million office jobs suggests that we are going to see nationwide commercial vacancy rate of 20%; rents have already deflated 17% from the highs (more like 50% in places like Manhattan) and more declines are sure to come. As banks allocate more reserves in light of more writeoffs, the pressure to raise more capital is going to be intense.

Bounce In Bankruptcies

The number of U.S. companies that filed for Chapter 11 last month totalled 7,771— a 7.0% jump from September. Obviously these firms were not canvassed in the most recent ISM survey. Clearly, what we have on our hands is a situation where there are still far too many companies and individuals reeling from the effects of the credit collapse. We can understand the need for economists to wax about a 3.5% real GDP growth rate, but let's sit back, take a deep breath and understand that this is not the only measure of economic health.

Just as the Bank of Canada stressed in its last policy statement (October 20) that "the resumption in growth is supported by monetary and fiscal stimulus" and made no attempt to convince market participants that it was about to embark on a shift in policy, one would have to think that Mr. Bernanke's head is in the same space as Mr. Carney's. We will find out at 2:15 pm today, but to play around too much with the Fed press statement, especially changing the wording of the commitment to sustain its accommodative posture for an "extended period" would be a grave mistake, in our view.

Clearly, what we have on our hands is a situation where there are still far too many companies reeling from the effects of the credit collapse. Whether we are talking about housing, jobs or consumer spending, it still looks as though government assistance is still at the cutting edge between recession and expansion

The ADP Employment Report A Tad Worse Than Expected

ADP fell 203k in October— but September was revised higher, to -227k from -254k, which helps reduce some of the negativity around the headline for October (plus the news today that layoff announcements in the U.S., according to the Challenger report, hit their lowest level in 17 months). Moreover, the consensus was at -198k for the October ADP, so this was a "modest miss".

The ISM employment index had seemed to hint of stability at the very least in factory payrolls, but manufacturing employment actually fell by 65k in this report. The bright spot: it was the 'least negative' number since July 2008. (Come on, bring on those green shoots again!)

ADP has been overstating the weakness in private payrolls in the nonfarm payroll report survey in each of the past five months, so it would be a mistake to extrapolate from the ADP number (the consensus on payrolls this Friday is -175k). This could be because the ADP has a small-company "bias" to it— many large companies do their own payroll and as such do not use the payroll agency— and right now it is small businesses that are having the most trouble accessing credit for working capital (ie, staffing) purposes.

All that said, a -203k print on ADP is pretty horrible as a stand alone figure. The worst it ever got in the 2001 recession, post 9/11 terrorist attacks aside, was -212k.

No Reason For The Homebuilders To Like This Except

…it will accelerate talk of the need for even more pronounced housing tax credits (where the money is going to come from to pay for all this is ostensibly something that must have been going through the minds of India's central bank officials over the past few days). This morning we received the data for the past week on mortgage applications. While the overall index rose 8.2%, it was due to the spike in the volatile refinancing component, which rebounded 14.5%.

What is key for economic activity in a more direct sense is what the index of new home purchases is doing— and it fell 1.8% and is now down four weeks in a row. Not good news. In fact, two months of gains were aborted, again in a sign of how the economy really looks once the medicine is removed by Uncle Sam (or perceptions of such— in this case, the first-time buyer tax credit). In October, mortgage applications for new purchases plunged at a 34% annual rate and are now down to levels last seen in February— when the word "depression" was being bandied about. Whether we are talking about housing, jobs or consumer spending, it still looks as though government assistance is still at the cutting edge between recession and expansion.

Gold Glitters

Gold is in bull mode because of many factors, one being that the U.S. will continue to promote 'short-term' solutions to ensure that the economy embarks on an uptrend.

While the gold purchase by India's central bank is widely viewed as the trigger point for the latest jump in the gold price, there are good reasons why bullion is in bull mode. It comes down to a fiscal policy in the U.S.A. that will stop at nothing to ensure that the economy embarks on an uptrend. Even with a fiscal deficit north of 10% of GDP, the article from yesterday's WSJ that was titled Job-Creation Panel Leery of Spending really resonated. To wit:

"So far, the White House and Congress have been weighing a range of short-term tax ideas to spur job growth, such as expanded refunds for big companies that suffered losses; extension of a first-time homebuyer tax credit; and a new tax credit for hiring."

So the strategy remains on "short-term" tactics as opposed to any long-run measures to improve the capital stock, enhance skills and training, bolster education and enhance productivity growth. If Milton Friedman taught us anything from the permanent income hypothesis, it was that changes to income or wealth that are perceived to be permanent have a much more beneficial and enduring effect than measures that are only transitory. But of course the other problem is who will pay for this fiscal largesse, and the answer is nobody— the Fed will simply monetize the debt [[so, in the end, we all wind up paying— largely for the greed, hubris, and other excesses of those "too big to fail!" But, at least those bonuses seem safe…: normxxx]]. More dollars will be printed and that is bullish for gold whose production is in secular decline.

Then we saw this article on the WSJ yesterday too, titled Labor Gets Boost In Skies, on Rails. Anyone involved in the markets, has to read this article and understand the differences between what is happening now and when the secular bull market began under Reagan administration in the early 1980s. To wit:

"Organized labor appears to be gaining the upper hand in the skies and on the rails, as labor and business battle for influence under the Obama administration.

Another reason for our bullish stance on gold is that we are not seeing the onset of a secular bull market in equities like the one we saw in the early 1980s

The National Mediation Board wants to make it easier for thousands of airline and railway workers to unionize under the Railway Labor Act by seeking to junk a 75-year old election rule, according to a proposal published Monday in the Federal register. The move comes after a White House appointment shifted the balance of the government agency's three-person board. Linda Puchala, a former flight attendant union leader, was selected to replace Read Van de Water, a former Northwest Airlines lobbyist, earlier this year."

To reiterate, this is not the onset of a sustainable secular bull market in equities as we had coming off the fundamental lows of prior bear phases, such as August 1982, when:

• Dividend yields were 6%, not sub 2% (currently)
• Price-to-earnings multiples were
8x, not 26x
• The market traded at book value, not
OVER two times book
• Inflation and bond yields were in double digits and headed down in the future, not near-zero and only headed higher
• The stock market competed with
18% cash rates, not zero, and as such had a much higher hurdle to clear
• Sentiment was
universally bearish
[[after more than a decade of bad stock market performance: normxxx]]; hardly the case today
• Global trade flows were in the process of
accelerating as barriers were taken down; today, we are seeing trade flows recede as frictions, disputes and tariffs become the order of the day
• Unionization rates were on a secular decline;
today labor power is clearly on the rise
• A Reagan-led movement was afoot to reduce the role of government with attendant productivity gains in the future; as opposed to the infiltration by the public sector into the capital markets, union sector, economy and of course, the realm of CEO compensation.


Final Word On Gold

Gold broke out to a new high yesterday of $1,084/oz (and continues to rally today). It did this despite the S&P 500 managing to tick up two points and despite the DXY index actually eking out an 8bps rise to 76.3. This is NOT just a U.S. dollar story— have a look at what bullion is doing in Euro terms. Very impressive. This is a broadly based breakout and that means a durable secular bull market.

Looking at the growth rates in fiat currency that central banks are creating to stimulate their economies and the amount of bullion that would be necessary to back up this massive global monetary infusion suggests that gold can at least double if not triple from here. If you missed the first 4x runup from the $250/oz lows a decade ago, don't worry about it. It's like worrying about how you would have missed the first half of the rally in the S&P 500 from 1982 to 1992 when the index was at 400 and still had 300% to go before finally peaking out and sputtering at the 1500+ highs eight years later. In other words, the cup is still half full— and still can be filled with gold eagle coins.

ߧ

Normxxx    
______________

The contents of any third-party letters/reports above do not necessarily reflect the opinions or viewpoint of normxxx. They are provided for informational/educational purposes only.

The content of any message or post by normxxx anywhere on this site is not to be construed as constituting market or investment advice. Such is intended for educational purposes only. Individuals should always consult with their own advisors for specific investment advice.

Jeff Saut Says Buy The Dip

Jeff Saut Says Buy The Dip

By The Pragmatic Capitalist | 4 November 2009

Jeff Saut continues to think the current dip should be bought heading into year-end. Yesterday's action [[3 November: normxxx]] in the transports following Buffett's purchase of BNI will certainly confirm Saut's belief that we did not and will not get a Dow Theory sell signal. After the near[!?!] Dow Theory sell signal, Saut was quick to quote Russell, who has been quite cautious of late:

The secret of the direction of the great primary trend of the market lies in the secondary reaction and what happens AFTER a secondary reaction. A secondary reaction usually takes three weeks to three months in duration while correcting one-third to two-thirds of the previous move. Since the March low, we have yet to experience a true secondary reaction. And I'm wondering whether we could be on the edge of a secondary reaction now.

Following a secondary (reaction), if
BOTH Averages (Industrials and Transports) rise to new highs, the primary trend is taken to be bullish. Following the lows of a secondary reaction, there will be a rally. If (that) rally fails to take both Averages to new highs, and the Averages then turn down and break to new (reaction) lows, the primary trend is taken to be as bearish. Secondary reactions often start with one of the Averages sinking while the other Average continues to the upside.

With that said, Saut maintains his bullish view based on the idea that money managers will be forced to continue playing catch-up into year-end. Saut is unfazed by the recent downturn in stocks and believes the most investors have been hoping for such an opportunity:

…last week's "wilt" left everything we follow lower except for the U.S. Dollar Index. And while the DJIA (9712.73) averted a loss in October, none of the other indices we monitor did. Indeed, the S&P 500 (SPX/1036.19) slid 3.9%, bringing its two-week retreat to 5.6%. While our sense is that we are into a secondary correction, our proprietary overbought/oversold indicator is VERY oversold and the number of S&P 500 stocks that are above their 50-DMAs has fallen from more than 90% to 33.2%. Consequently, we continue to think it is a mistake to get too bearish. Ergo, until Dow Theory "tells us" otherwise, we think the primary trend remains UP, and we continue to trade, and invest, accordingly.

Saut is not alone in his sentiment. In fact, there appears to be a growing consensus that the rally will continue into the end of the year for none of the right reasons. In other words, the rally is expected to continue as investors fight to get to the top of the molehill. But be careful, as Saut says, there is also a growing consensus that 2010 will be a potentially treacherous year for investors.