Bernanke's Recession Is Here: 11 Reasons It Will Last Till 2011
By Paul B. Farrell, Marketwatch | 28 February 2008
ARROYO GRANDE, Calif.— Remember that hot 1973 Stealer's Wheel song marking the end of the Nixon era? "'Cause I don't think that I can take anymore. Clowns to the left of me, jokers to the right, here I am stuck in the middle with you!" It's still a perfect metaphor. Testifying before Congress: Fed Chairman Ben Bernanke on the left. Treasury Secretary Henry Paulson on the right. The American public stuck in the middle. Last summer they assured us the subprime-credit crisis was "contained." We now know that was a big lie. They knew, had the facts, early warnings, lied and are still lying. More proof? They just told Congress: "America will avoid a recession." Latest data tells a different story.
Clowns to the left ... jokers right ... stuck in the middle ... can't take it anymore. But we have to, we have to hang on at least 10 months more, praying they won't do too much more damage. But I'm afraid they will: more lies, blunders and incompetence will drag out this bear. Like the song says: "Got a feeling
something ain't right." Read the new InvestmentNews a professional journal for financial advisers. The lead headline grabs you: "Bad times for stocks could last many years." A long secular bear.
Do you believe it? That's the big question today: When's the next bull? How long will the bear last? And forget Washington's rhetoric about "no recession." The truth is, you can call it a "bear," "slow growth," a "downturn," a "recession"— call it whatever you want. Timing's the real question. How long will it last? When will it bottom? 2008? 2011?
Test your timing skill. You tell us, what'll drag this out 30 months, like in 2000-2002? Or shorten it? Here are 11 critical factors for your timing equation, things that could make this bear-recession shorter or longer. You tell us. Add a comment. What's your prediction: How long before the next bull?
1. Stagflation: Bernanke's no-win Achilles heel
Reading Fed-watcher William Fleckenstein's new book, "Greenspan's Bubbles: The Age of Ignorance at the Federal Reserve," you get the feeling that for 18 years America's banking system was run like a "new age" hippy commune, by a Ayn Rand free spirit who believed "anything goes." Now the Fed's run by a college professor and Fleckenstein says he's "in over his head."
Except this is the real world, a $13 trillion economy in a $48 trillion world, not a college seminar on economic theory. In the 1970s Nixon faced a similar problem, convinced then by Fed Chairman Arthur Burns: "No one ever lost an election on account of inflation." Wrong! Low rates generated inflation not growth. That stagflation triggered a bear/recession. Is Professor Ben trapped, repeating history?
2. Housing-credit meltdown: We've got a long way to go!
It's far from over folks and still spreading: Years of inventory, foreclosures, building slowdown, risky bond insurers, weak rating agencies, funds holding bad debt, freezing exits and fuzzy math on values. Yet Bernanke and Paulson still live in a Washington bubble of wishful-thinking fantasies.
Economic realists say what's needed is a massive $1.6 trillion demand-driven program (that's the record cash Corporate America's hoarding) not a dinky $160 billion supply-side "appease the voters" giveaway that ends up increasing the odds of a lengthy Nixon/Burns style bear-recession.
3. Commodities: World's new reserve 'currency,' not dollars
Forget paper money and IOUs. Commodities are the world's new "currency:" Hard stuff like oil, grains, metals, gold. And that means America is financing the growth of our enemies, surrendering our long-term economic power for short-term oil-guzzlers and plastic toys. We are responsible for making Russia and China into threatening world powers. Buffett warned us. We're selling the farm, piece by piece.
4. Toxic derivatives: World's $516 trillion ticking time bomb
Derivatives are great for deal-by-deal risk management in a $48 trillion GDP world. But leverage them 10 times over across the globe and we got a financial "weapon of mass economic destruction." Bill Gross warns that the world's new unregulated "shadow banking system" is printing new money, now at $516 trillion, out of thin air, with no "central banks of last resort" backing up the "Frankenstein" monsters they've created.
5. Massive debt: Everywhere, trade, federal, states, local
America's Comptroller General David Walker, Congress's head accountant who is leaving his position next month, warns our government is "bankrupting America." Using unethical accounting worse than Enron's. Fiscal responsibility lost. He sees "striking similarities" with Rome. Both parties are gluttons in a spending orgy. We spend-spend, load debt on future generations, then use accounting gimmicks to hide our greedy excesses: Hidden earmarks. Supplemental war appropriations. Meaningless IOUs after stealing from Social Security.
6. America's new 'pushers': Banks feeding consumer addicts
Trader's Daily captured it perfectly: "Never underestimate the power of the superpsycho, hyper-spending American consumer. Where there is no cash, they will sell their soul. Or just charge it. Let's just not think about what it all means for credit-card debt down the road." Meanwhile, the credit meltdown is making banks desperate for money. A recent Chase credit-card commercial fuels consumer addictions: Wife wants bigger television. Husband smiles. They shop to the pounding drumbeat of Queen's hit 80s song: "I want it all, I want it all, I want it all ... and I want it now!" Tag line: "Chase what matters!" Yes, Chase debt, all you addicts. Forget saving, spend like there's no tomorrow.
7. More wars: Pentagon predicts bigger, costlier conflicts
The Pentagon's internal studies see a perfect storm accelerating wars worldwide: Global population growth, limited natural resources and global warming. Our war machine is exploding. The Pentagon gets over 50% in the new federal budget. We're only 21% of the world's GDP, yet spend 47% of the world's total military expenditures. Our power-hungry mindset is becoming self-destructive, suicidal. Remember Nixon strategist Kevin Phillips' warning: "Most great nations, at the peak of their economic power, become arrogant and wage great world wars at great cost, wasting vast resources, taking on huge debt, and ultimately burning themselves out."
8. Greed: Wall Street and Corporate America's defining 'value'
Values start at the top. But the top won't change for 10 months. Leadership, statesmanship and character are vanishing. Five short years ago Corporate America and the mutual fund industry were consumed by greed. How quickly we forget. It's worse today. We see greed consuming not just Wall Street's clueless CEOs, but the entire industry: Outrageous bonuses of $38 billion amid mega-billion write-offs. Fire sales of billions more American equity to sovereign nations. From the top down, greed is driving America from bubble to bubble. Wall Street's already fueling the next bubble, trading on a volatile market.
9. Democracy failing: America now run by 35,000 lobbyists!
Forget government "of the people, by the people, and for the people." Adam Smith's "invisible hand" is now a small group of 35,000 highly paid, greedy lobbyists demanding handouts. They run America from the shadows, for those at the top of the economic food chain and vastly outnumber Washington's 537 elected officials. Nationally there's an estimated quarter million lobbyists, with hundreds of millions of dollars to buy favors in campaign contributions. Politicians talk "change," but America's lobbyists will still be working for their special interest clients in 2009. And they'll fight all "changes."
10. America's already in a recession, and in denial
This year's elections will be a huge factor in lengthening the recession. Our [[divided,: normxxx]] lame-duck government will delay action on critical issues. It reminds me of my days counseling addicts and alcoholics. Change never happened until they admitted they had a problem. Same here; same now. Vote for whomever, but this lame-duck mindset plus lingering partisan rancor will push any recovery at least into 2009, probably delay the next bull till 2010 or 2011.
Paulson and Bernanke can't even admit there's a recession. They'd have to take the blame for America's failed policies. And congressional Democrats are weak co-conspirators in this meltdown. Nobody has the guts to take responsibility. They're all like addicts and alcoholics, in denial, giving lip-service to "change," while they blame the other guys and support ineffectual stimulus plans.
11. Class warfare: Superrich vs. Main Street America
No matter who wins, the presidential campaign is warning us: A major battle's coming between "the rich and the rest"— over taxes, benefits, cuts, power. For years the media collaborated with Wall Street and Corporate America, hyping "Ownership, the New American Dream," where everyone benefits, shares the wealth, gains a piece-of-the-action, ownership in "The Dream" through the magic of housing, stocks, growth, profits, retirement plans. But the housing-credit contagion killed the dream.
Yes, the superrich did get richer. But "the rest" didn't. And they're waking up to a widening gap. A backlash is brewing and will explode ... delaying a recovery and a new bull. Clowns to the left, jokers on the right, we're stuck in the middle. Can't take it anymore? Add a timing comment. Tell us: When's the recovery? Next bull? Late 2008? Not till 2011?
ߧ
Normxxx
______________
The contents of any third-party letters/reports above do not necessarily reflect the opinions or viewpoint of normxxx. They are provided for informational/educational purposes only.
The content of any message or post by normxxx anywhere on this site is not to be construed as constituting market or investment advice. Such is intended for educational purposes only. Individuals should always consult with their own advisors for specific investment advice.
Friday, February 29, 2008
Will India Unload Gold!?!
Will India Unload A Massive Quantity Of Gold & Silver On The Markets?
By Julian D.W. Phillips | 29 February 2008
Gold and silver prices are at their peak and look as though they are going to go higher still. Both gold and silver prices have been rising steadily over the years despite there being both a surplus and, in the case of silver, government selling of stockpiles. This tells us that the potential as well as the past surpluses are far lower and far more difficult to access than one thinks. Why?
The prime overall reason is that statistics may show these figures but are these amounts really available in the market place? The surplus is an overall figure that may or may not reach the marketplace. Whatever the surplus is, it will appear steadily over the year, not at any one time such as the start point. The current gold & silver prices tell us that neither is available over and above current market demand, or the prices of both would not be rising. At best, the full real picture of the gold & silver markets is nigh on impossible to quantify accurately (including the gold and silver stored away from statisticians eyes). How much gold & silver will come off tables and arms and ears and go down to a scrap merchant (then to the refinery and then to the market and et cetera) cannot be measured.
Take the situation in India, where the silver and gold markets, we are told, are very quiet and have been for several months. There are huge volumes of gold & silver bought over the last few decades there, so why doesn't it leave the homes in which it is kept and travel to the market? Why don't merchants then take it in at the prices they offer, parcel it up and ship it to the international markets to get the apparent profit?
 In India, the main buyers of silver and gold [70%] are rural people, who do not suffer income tax on their farming income. When they sell their produce they are paid cash and don't generally have a bank account. Rather than keep this paper medium of exchange in their house, they take the money and buy gold and silver for cash, which then make up their savings. Over the last few years the rising prices of the two precious metals has confirmed the wisdom of such policies.
However, should the need arise for them to sell their gold and silver, they approach their dealer. When he buys, he has to report the transaction "officially" and pay purchase tax, which is enormous relative to his profits. He also would have to expose his complete business to the authorities, whose reputation for administering businesses is appallingly corrupt. Should he then want to export this purchased metal, he needs to reflect the metal in his accounts and confirm purchase tax has been paid. With a similar aversion to tax as one has to the plague, dealers buy such scrap for cash and hoard it in their own private, invisible stores. Then out of the sight of Indian authorities again, he will hedge his long position on the international exchanges through a short position, matching the long position he has, thus removing the price risk on the metal (all this done in a secretive manner).
 "There will be no exports of gold or silver from India!"
Remarkably, NO gold or silver is exported from India, despite the invisible surplus. The only sign of it is in the short positions [Commercial] on international exchanges. Hoarding of gold and silver in India is huge, proven by the fact that none is exported. More to the point: None will be exported; no matter what the gold and silver prices go to!
ߧ
Normxxx
______________
The contents of any third-party letters/reports above do not necessarily reflect the opinions or viewpoint of normxxx. They are provided for informational/educational purposes only.
The content of any message or post by normxxx anywhere on this site is not to be construed as constituting market or investment advice. Such is intended for educational purposes only. Individuals should always consult with their own advisors for specific investment advice.
By Julian D.W. Phillips | 29 February 2008
Gold and silver prices are at their peak and look as though they are going to go higher still. Both gold and silver prices have been rising steadily over the years despite there being both a surplus and, in the case of silver, government selling of stockpiles. This tells us that the potential as well as the past surpluses are far lower and far more difficult to access than one thinks. Why?
The prime overall reason is that statistics may show these figures but are these amounts really available in the market place? The surplus is an overall figure that may or may not reach the marketplace. Whatever the surplus is, it will appear steadily over the year, not at any one time such as the start point. The current gold & silver prices tell us that neither is available over and above current market demand, or the prices of both would not be rising. At best, the full real picture of the gold & silver markets is nigh on impossible to quantify accurately (including the gold and silver stored away from statisticians eyes). How much gold & silver will come off tables and arms and ears and go down to a scrap merchant (then to the refinery and then to the market and et cetera) cannot be measured.
Take the situation in India, where the silver and gold markets, we are told, are very quiet and have been for several months. There are huge volumes of gold & silver bought over the last few decades there, so why doesn't it leave the homes in which it is kept and travel to the market? Why don't merchants then take it in at the prices they offer, parcel it up and ship it to the international markets to get the apparent profit?
In India, the main buyers of silver and gold [70%] are rural people, who do not suffer income tax on their farming income. When they sell their produce they are paid cash and don't generally have a bank account. Rather than keep this paper medium of exchange in their house, they take the money and buy gold and silver for cash, which then make up their savings. Over the last few years the rising prices of the two precious metals has confirmed the wisdom of such policies.However, should the need arise for them to sell their gold and silver, they approach their dealer. When he buys, he has to report the transaction "officially" and pay purchase tax, which is enormous relative to his profits. He also would have to expose his complete business to the authorities, whose reputation for administering businesses is appallingly corrupt. Should he then want to export this purchased metal, he needs to reflect the metal in his accounts and confirm purchase tax has been paid. With a similar aversion to tax as one has to the plague, dealers buy such scrap for cash and hoard it in their own private, invisible stores. Then out of the sight of Indian authorities again, he will hedge his long position on the international exchanges through a short position, matching the long position he has, thus removing the price risk on the metal (all this done in a secretive manner).
"There will be no exports of gold or silver from India!"Remarkably, NO gold or silver is exported from India, despite the invisible surplus. The only sign of it is in the short positions [Commercial] on international exchanges. Hoarding of gold and silver in India is huge, proven by the fact that none is exported. More to the point: None will be exported; no matter what the gold and silver prices go to!
ߧ
Normxxx
______________
The contents of any third-party letters/reports above do not necessarily reflect the opinions or viewpoint of normxxx. They are provided for informational/educational purposes only.
The content of any message or post by normxxx anywhere on this site is not to be construed as constituting market or investment advice. Such is intended for educational purposes only. Individuals should always consult with their own advisors for specific investment advice.
Will India Unload !?!
Will India Unload A Massive Quantity Of Gold & Silver On The Markets?
By Julian D.W. Phillips | 29 February 2008
Gold and silver prices are at their peak and look as though they are going to go higher still. Both gold and silver prices have been rising steadily over the years despite there being both a surplus and, in the case of silver, government selling of stockpiles. This tells us that the potential as well as the past surpluses are far lower and far more difficult to access than one thinks. Why?
The prime overall reason is that statistics may show these figures but are these amounts really available in the market place? The surplus is an overall figure that may or may not reach the marketplace. Whatever the surplus is, it will appear steadily over the year, not at any one time such as the start point. The current gold & silver prices tell us that neither is available over and above current market demand, or the prices of both would not be rising. At best, the full real picture of the gold & silver markets is nigh on impossible to quantify accurately (including the gold and silver stored away from statisticians eyes). How much gold & silver will come off tables and arms and ears and go down to a scrap merchant (then to the refinery and then to the market and et cetera) cannot be measured.
Take the situation in India, where the silver and gold markets, we are told, are very quiet and have been for several months. There are huge volumes of gold & silver bought over the last few decades there, so why doesn't it leave the homes in which it is kept and travel to the market? Why don't merchants then take it in at the prices they offer, parcel it up and ship it to the international markets to get the apparent profit?
In India, the main buyers of silver and gold [70%] are rural people, who do not suffer income tax on their farming income. When they sell their produce they are paid cash and don't generally have a bank account. Rather than keep this paper medium of exchange in their house, they take the money and buy gold and silver for cash, which then make up their savings. Over the last few years the rising prices of the two precious metals has confirmed the wisdom of such policies.
However, should the need arise for them to sell their gold and silver, they approach their dealer. When he buys, he has to report the transaction "officially" and pay purchase tax, which is enormous relative to his profits. He also would have to expose his complete business to the authorities, whose reputation for administering businesses is appallingly corrupt. Should he then want to export this purchased metal, he needs to reflect the metal in his accounts and confirm purchase tax has been paid. With a similar aversion to tax as one has to the plague, dealers buy such scrap for cash and hoard it in their own private, invisible stores. Then out of the sight of Indian authorities again, he will hedge his long position on the international exchanges through a short position, matching the long position he has, thus removing the price risk on the metal (all this done in a secretive manner).
"There will be no exports of gold or silver from India!"
Remarkably, NO gold or silver is exported from India, despite the invisible surplus. The only sign of it is in the short positions [Commercial] on international exchanges. Hoarding of gold and silver in India is huge, proven by the fact that none is exported. More to the point: None will be exported; no matter what the gold and silver prices go to!
ߧ
Normxxx
______________
The contents of any third-party letters/reports above do not necessarily reflect the opinions or viewpoint of normxxx. They are provided for informational/educational purposes only.
The content of any message or post by normxxx anywhere on this site is not to be construed as constituting market or investment advice. Such is intended for educational purposes only. Individuals should always consult with their own advisors for specific investment advice.
By Julian D.W. Phillips | 29 February 2008
Gold and silver prices are at their peak and look as though they are going to go higher still. Both gold and silver prices have been rising steadily over the years despite there being both a surplus and, in the case of silver, government selling of stockpiles. This tells us that the potential as well as the past surpluses are far lower and far more difficult to access than one thinks. Why?
The prime overall reason is that statistics may show these figures but are these amounts really available in the market place? The surplus is an overall figure that may or may not reach the marketplace. Whatever the surplus is, it will appear steadily over the year, not at any one time such as the start point. The current gold & silver prices tell us that neither is available over and above current market demand, or the prices of both would not be rising. At best, the full real picture of the gold & silver markets is nigh on impossible to quantify accurately (including the gold and silver stored away from statisticians eyes). How much gold & silver will come off tables and arms and ears and go down to a scrap merchant (then to the refinery and then to the market and et cetera) cannot be measured.
Take the situation in India, where the silver and gold markets, we are told, are very quiet and have been for several months. There are huge volumes of gold & silver bought over the last few decades there, so why doesn't it leave the homes in which it is kept and travel to the market? Why don't merchants then take it in at the prices they offer, parcel it up and ship it to the international markets to get the apparent profit?
In India, the main buyers of silver and gold [70%] are rural people, who do not suffer income tax on their farming income. When they sell their produce they are paid cash and don't generally have a bank account. Rather than keep this paper medium of exchange in their house, they take the money and buy gold and silver for cash, which then make up their savings. Over the last few years the rising prices of the two precious metals has confirmed the wisdom of such policies.However, should the need arise for them to sell their gold and silver, they approach their dealer. When he buys, he has to report the transaction "officially" and pay purchase tax, which is enormous relative to his profits. He also would have to expose his complete business to the authorities, whose reputation for administering businesses is appallingly corrupt. Should he then want to export this purchased metal, he needs to reflect the metal in his accounts and confirm purchase tax has been paid. With a similar aversion to tax as one has to the plague, dealers buy such scrap for cash and hoard it in their own private, invisible stores. Then out of the sight of Indian authorities again, he will hedge his long position on the international exchanges through a short position, matching the long position he has, thus removing the price risk on the metal (all this done in a secretive manner).
"There will be no exports of gold or silver from India!"Remarkably, NO gold or silver is exported from India, despite the invisible surplus. The only sign of it is in the short positions [Commercial] on international exchanges. Hoarding of gold and silver in India is huge, proven by the fact that none is exported. More to the point: None will be exported; no matter what the gold and silver prices go to!
ߧ
Normxxx
______________
The contents of any third-party letters/reports above do not necessarily reflect the opinions or viewpoint of normxxx. They are provided for informational/educational purposes only.
The content of any message or post by normxxx anywhere on this site is not to be construed as constituting market or investment advice. Such is intended for educational purposes only. Individuals should always consult with their own advisors for specific investment advice.
Thursday, February 28, 2008
Not Your Father’s Mustache!?!
Investment Strategy: "Not Your Father’s Typical Recession!?!"
By Jeffrey Saut February, 2008
Much has been written recently about whether the nation is "in" a recession, going into a recession, or not going into a recession. To answer this question, one first needs to define what a recession is. Back in the 1960’s we used to say, "A recession is when your neighbor loses his job; a depression is when you lose your job!" Of course, the modern day definition has become: "Two or more consecutive quarters of negative growth in Gross Domestic Product (GDP)."
However, I could make a pretty cogent argument that the population employment growth increases by roughly 1% a year and, therefore, if GDP growth falls below 1%, we are not employing all the available talent, and consequently, the country by default would be in a recession— but nobody agrees with my definition. The most accurate definition [[as widely accepted: normxxx]] is proffered by the National Bureau of Economic Research (NBER) that frames it this way:
Rare indeed, as seen in the recession charts we included in last week’s report and have attached again this week.
By studying the charts, one observes that until recently recessions have been a normal conclusion to the business cycle. As seen, however, recently this has not been the case. In past missives we have railed at the central banks, as well as the politicians, for their continuing efforts to prevent the normal business cycle from playing out. They did it again in January when the Federal Reserve panicked and cut interest rates by 75 basis points with a concurrent $150 billion economic stimulus package from the politicos. And if this is a typical recession, such maneuvers will likely ameliorate the downturn. But, what if this isn’t "your father’s typical recession?"
Consider this: typically a recession follows a tightening cycle by the central banks causing the entire interest rate spectrums’ yields to rise sharply. Clearly, this has not been the case. Moreover, recessions tend to occur in a high "real" interest rate environment where interest rates are higher than the inflation rate. Currently, when you compare the nominal, or headline, inflation rate to ANY of the government complex of interest rate yields (Fed Funds, 2-year T’bill, 10-year T’note, etc.), you find "negative" real interest rates.
Ladies and gentlemen, negative real rates have always sewn the seeds of economic recoveries. Further, recessions are accompanied by soaring unemployment reports, and heretofore this is just not happening. The final ingredient of the typical recession is a huge buildup of inventories, but given the current record low inventory-to-sales ratio, this too doesn’t "foot." Therefore, if we are entering a recession, it is probably a financially-induced recession and not your father’s typical recession, begging the question, "Will the typical remedies work?"
How we got into this mess can be directly traced to the "powers that be" attempting to stave off the normal business cycle via the engineering of a too-low Fed Funds interest rate (1%), too much liquidity (pumping up the money supply), and a financial complex that spun the situation into a spider web of leverage resulting in an enormous abuse of credit. See if you can follow this, too many fancy loans were made to people who could not afford them (No Doc Loans, 125% Mortgages, Option Arms, etc.). These loans were then packaged into residential and commercial mortgage-backed securities (RMBS / CMBS); and, in turn….
The RMBS / CMBS were repackaged into collateralized loan obligations (CLOs) which, after receiving some sort of insurance, were then yet further hedged using credit default swaps (CDSs). And, these complex securities were sold into even more complex vehicles like Structured Investment Vehicles (SIVs). At each step, more and more leverage (read: debt) was employed, leaving the entire mess looking like an inverted pyramid with the lonely mortgagee at the bottom, causing economist Hy Minsky to note, "All panics, manias and crises of a financial nature have their roots in an abuse of credit."
Panic, indeed, for when the poor mortgagees stopped paying their loans, the inverted pyramid toppled right about the time when the financial community was closing their year-end "books," which is why we have seen so many write-offs in the new year, as well as why the equity markets have been in a selling stampede. And, it looked like the equity markets were on their way to completing the stampede with a pornographic panic plunge one January morning— until the Fed panicked and cut interest rates by 75 bps before the opening bell. At the time we were speaking to The Wall Street Journal and remarked, "While Mr. Bernanke is clearly a very smart man, he seems to lack the market savvy of Paul Volcker in an era gone by."
To wit, if Mr. Volcker were still at the helm of the Fed, we think he would have let the markets plunge 500, 800, or even 1000 points so that they would reach a downside "clearing price" on their own accord. When they hit that low, stabilized and started to "lift," then and only then would Tall Paul have cut interest rates to "seal in" that low and put the wind at the back of the markets for a sustainable rally. What Mr. Bernanke did was best summarized by one old Wall Street wag who exclaimed, "He’s used the last aspirin in the bottle, yet we still have the headache!"
That headache spilled over several more sessions later, but on the day, the DJIA was off over 300 points early, then righted itself to close up nearly 300 points. That volatility gave us the second largest daily point swing in history and suggested a short-term trend change for the markets. Was it perfect? . . . Not really, because we never got the "I think I am going to be sick type of downside panic hour" so often associated with selling climax lows. (It did, however, come on day 18 of the envisioned 17 - 25 session 'selling stampede', so the timing was right); we recommended committing a modicum of capital to stock— so far, so good.
So where does this leave us? Well, the equity markets strung together three or more "up" sessions, indicating that the selling stampede is over. And, as long as those lows hold (11971 closing and/or 11634 intraday), we still have a chance of a good rally. Worrisome is the fact that there is a ubiquitous feeling that any downside retest of those lows will be successful and consequently should be bought.
While we are hopeful that will be the case, if those lows don’t hold, we will be at the point of capitulation where participants throw in the towel and walk away. We are also at the point where you are going to hear whispers about a friend being in financial trouble due to too much debt. Recall it was the January 4th employment report that accelerated the stock slide into a selling stampede, which we said would likely extend until the State of the Union address.
In the meantime, one theme we are certain of is "yield." The retiring baby boomers want yield in their retirement years combined with an adequate rate of return. This is consistent with Benjamin Graham’s definition of an investment operation, which reads, "An investment operation is one which, upon thorough analysis, promises safety of principal and an adequate return. Operations not meeting these requirements are speculative."
With interest rates near historic lows, bonds may satisfy the "safety of principal" requirement, but it is doubtful they will provide an "adequate return." The burgeoning demand by the "boomers" for yield should provide support for select dividend-paying stocks. One such name for your consideration is 7.5% yielding EV Energy Partners (EVEP/$30.01 /Outperform).
The call for this week: The question du jour is, "Will the rate cuts, combined with the economic stimulus package, be enough to prevent the normal ending to the business cycle even if this is not your father’s typical recession?" Evidentially, the D-J Transports think so given their current rally mode! Yet even if successful, the nation faces a painful deleveraging process that will take time. As John Stuart Mill wrote in 1867, "Panics do not destroy capital; they merely reveal the extent to which it has been previously destroyed into hopelessly unproductive works."

Click Here, or on the image, to see a larger, undistorted image.

Click Here, or on the image, to see a larger, undistorted image.
"Foretold is Forewarned"
Ever since the successful downside retest of the August 2007 "lows" that occurred in late November, we have repeatedly stated that while we remained constructive on stocks into year-end 2007, we were entering 2008 in a cautious mode. We reiterated that caution the first week of January when we said:
Regrettably, those employment numbers were ugly and we went on to warn participants that the stock slide was taking on the characteristics of a "selling stampede." As often stated in these missives, "selling stampedes", and/or "buying stampedes", typically last 17 to 25 sessions with only one— to three-day counter trend "pauses" before they exhaust themselves.
It just seems to be the rhythm of the thing in that it takes participants that long to either get bearish enough, or bullish enough, to capitulate; and, in the current case, "cough up" their stocks. While it is true a few stampedes have lasted 25 to 30 sessions, it is RARE to have one extend for more than 30 sessions.
Meanwhile, the "selling stampede," combined with softening economic statistics, has caused the politicians to spring into action with what looks to us like another ill-fated scheme to ward off the normal business cycle. Recall, it was on December 6, 2007 that the President’s last scheme debuted. Titled operation "Hope Now," it was designed to stop mortgage interest rates from resetting to higher levels and was supposed to help hundreds of thousands of mortgage holders. According to Barron’s, however, it has helped less than one hundred mortgagees to date.
Last week’s proposed "scheme" was a $145 billion economic-stimulus package, which is expected to contain hundreds of dollars of tax-rebates per taxpayer, as well as tax breaks to encourage businesses to buy new equipment. It seems to us that this scheme is also flawed since the current problems stem from too much debt. If so, recipients of the tax rebates will probably use them to pay down existing debts rather than spend them and stimulate the economy. As the President unveiled the plan, we found ourselves screaming at the TV screen, "Don’t you realize that trying to prevent the inevitable conclusion of the business cycle (read: recession) a few years ago is exactly what got us into the present predicament?!"
Clearly the Federal Reserve, like the politicos, is worried given Mr. Bernanke’s comments last week. Yet if the overspent, undersaved American consumer is finally sated with debt, the Fed could be "pushing on a string" by lowering interest rates. Further, the Fed may just be in a "box," for as Milton Friedman noted, "a central bank can control its exchange rates; it can control its money supply growth rate; or it can control its interest rate; but, it cannot control all three at the same time!"
However, ISI’s Ed Hyman framed the problem differently when he recently wrote, "Here’s the problem. If we have a U.S. recession, even a mild one, developing economies are likely to slow. U.S. unemployment is likely to rise above 5.5%. Developing economies are likely to dump goods on world markets. [And] All of this could launch protectionist legislation that would lead to the end."
Indeed, for many months we have railed against the increasing traction protectionism, intervention, and over-regulation are gaining inside the D.C. Beltway. The question thus becomes, "does growth collapse from here because of the weight of the credit crunch, or not?"
As the astute GaveKal organization opines,
To this point, it is worth considering that if congress approves the recently proposed defense spending plan, which calls for tens of billions of increased spending, it should spread massive amounts of dollars to small/medium businesses whose multiplier effect could go a long way in avoiding a recession. This is another reason we have been unwaveringly bullish on government IT, defense, and the homeland security complex for the past number of years. Most recently, we have turned constructive on the shares of Strong Buy-rated Cogent (COGT/$9.19).
With more than 500,000 aliens entering the U.S. every year the authorities need a 99.9% accurate fingerprint reading in less than 30 seconds, which is one of the products Cogent manufactures. The company’s $5.00 per share in cash implies that we are buying the rest of the company for $4.19 a share. If our analyst is correct, Cogent should earn $0.55 per share in 2009, meaning we are buying the shares at less than 10 times forward earnings (ex-cash per share). Since 2008 is a great product pipeline year, as well as a potentially favorable contract "win" year, we think the risk/reward ratio is right for investors.
To be sure, we continue to like the Government IT and Homeland Security themes. Still, the government service stocks have tumbled ~ 8% in January due to the broad market decline and in-line with the seasonal trading patterns seen in the group. Due to the sell-off, our sense is the group looks more attractive than it has in quite some time. Moreover, we think investors are beginning to look for investments that are acyclical to the broader market concerns surrounding the consumer, energy prices, subprime exposure, and housing problems. Given the current valuation, fundamentals, and lack of a fundamental correlation to the overall market, we believe the government services group can outperform the broader markets in 2008. In addition to Cogent, we see value in Stanley (SXE/$28.31/Outperform) and NCI (NCIT/$15.31/Outperform).
As for our Canadian jaunt recently, western Canada is "booming!" In Edmonton every other street was littered with signs proclaiming "help wanted!" This labor demand has occurred even in light of the new increased royalty-regime legislated by Alberta’s politicians. Clearly we over-reacted to said regime, but while we have not invested any new capital in Alberta since that regime decision, we have held our remaining "long" stock positions in the Abathasca Tar Sands companies. We remain bullish on Canada, consistent with our "stuff stock" theme; and don’t look now, but a headline in a British Columbia newspaper read, "B.C. Energy Shortfall Looming," which was a direct reference to the money that needs to be spent to upgrade B.C.’s electric infrastructure.
The call for this week: Last week Treasury Secretary Paulson, when referring to the potential economic stimulus plan, averred, "This is not an emergency. There is an urgent need." To which we ask, "If this is NOT an emergency, then why is it urgent?!" Clearly the politicos are worried about a recession and are pulling out all the "stops" to prevent the normal business cycle once again. While we don’t think the recession question will be answered for months, we do think the selling stampede is definitely at an end and suggest getting your "buy list" together for at least a trade and maybe something more. It will be interesting to see if, like us, the street interprets the Fed's January moves as "panic" [[they did: normxxx]]. Whatever the outcome, we think a change for the better is approaching and are busy readying accounts accordingly. And that’s the way it is! So get ready, get set….
Normxxx
______________
The contents of any third-party letters/reports above do not necessarily reflect the opinions or viewpoint of normxxx. They are provided for informational/educational purposes only.
The content of any message or post by normxxx anywhere on this site is not to be construed as constituting market or investment advice. Such is intended for educational purposes only. Individuals should always consult with their own advisors for specific investment advice.
By Jeffrey Saut February, 2008
Much has been written recently about whether the nation is "in" a recession, going into a recession, or not going into a recession. To answer this question, one first needs to define what a recession is. Back in the 1960’s we used to say, "A recession is when your neighbor loses his job; a depression is when you lose your job!" Of course, the modern day definition has become: "Two or more consecutive quarters of negative growth in Gross Domestic Product (GDP)."
However, I could make a pretty cogent argument that the population employment growth increases by roughly 1% a year and, therefore, if GDP growth falls below 1%, we are not employing all the available talent, and consequently, the country by default would be in a recession— but nobody agrees with my definition. The most accurate definition [[as widely accepted: normxxx]] is proffered by the National Bureau of Economic Research (NBER) that frames it this way:
|
By studying the charts, one observes that until recently recessions have been a normal conclusion to the business cycle. As seen, however, recently this has not been the case. In past missives we have railed at the central banks, as well as the politicians, for their continuing efforts to prevent the normal business cycle from playing out. They did it again in January when the Federal Reserve panicked and cut interest rates by 75 basis points with a concurrent $150 billion economic stimulus package from the politicos. And if this is a typical recession, such maneuvers will likely ameliorate the downturn. But, what if this isn’t "your father’s typical recession?"
Consider this: typically a recession follows a tightening cycle by the central banks causing the entire interest rate spectrums’ yields to rise sharply. Clearly, this has not been the case. Moreover, recessions tend to occur in a high "real" interest rate environment where interest rates are higher than the inflation rate. Currently, when you compare the nominal, or headline, inflation rate to ANY of the government complex of interest rate yields (Fed Funds, 2-year T’bill, 10-year T’note, etc.), you find "negative" real interest rates.
Ladies and gentlemen, negative real rates have always sewn the seeds of economic recoveries. Further, recessions are accompanied by soaring unemployment reports, and heretofore this is just not happening. The final ingredient of the typical recession is a huge buildup of inventories, but given the current record low inventory-to-sales ratio, this too doesn’t "foot." Therefore, if we are entering a recession, it is probably a financially-induced recession and not your father’s typical recession, begging the question, "Will the typical remedies work?"
How we got into this mess can be directly traced to the "powers that be" attempting to stave off the normal business cycle via the engineering of a too-low Fed Funds interest rate (1%), too much liquidity (pumping up the money supply), and a financial complex that spun the situation into a spider web of leverage resulting in an enormous abuse of credit. See if you can follow this, too many fancy loans were made to people who could not afford them (No Doc Loans, 125% Mortgages, Option Arms, etc.). These loans were then packaged into residential and commercial mortgage-backed securities (RMBS / CMBS); and, in turn….
The RMBS / CMBS were repackaged into collateralized loan obligations (CLOs) which, after receiving some sort of insurance, were then yet further hedged using credit default swaps (CDSs). And, these complex securities were sold into even more complex vehicles like Structured Investment Vehicles (SIVs). At each step, more and more leverage (read: debt) was employed, leaving the entire mess looking like an inverted pyramid with the lonely mortgagee at the bottom, causing economist Hy Minsky to note, "All panics, manias and crises of a financial nature have their roots in an abuse of credit."
Panic, indeed, for when the poor mortgagees stopped paying their loans, the inverted pyramid toppled right about the time when the financial community was closing their year-end "books," which is why we have seen so many write-offs in the new year, as well as why the equity markets have been in a selling stampede. And, it looked like the equity markets were on their way to completing the stampede with a pornographic panic plunge one January morning— until the Fed panicked and cut interest rates by 75 bps before the opening bell. At the time we were speaking to The Wall Street Journal and remarked, "While Mr. Bernanke is clearly a very smart man, he seems to lack the market savvy of Paul Volcker in an era gone by."
To wit, if Mr. Volcker were still at the helm of the Fed, we think he would have let the markets plunge 500, 800, or even 1000 points so that they would reach a downside "clearing price" on their own accord. When they hit that low, stabilized and started to "lift," then and only then would Tall Paul have cut interest rates to "seal in" that low and put the wind at the back of the markets for a sustainable rally. What Mr. Bernanke did was best summarized by one old Wall Street wag who exclaimed, "He’s used the last aspirin in the bottle, yet we still have the headache!"
That headache spilled over several more sessions later, but on the day, the DJIA was off over 300 points early, then righted itself to close up nearly 300 points. That volatility gave us the second largest daily point swing in history and suggested a short-term trend change for the markets. Was it perfect? . . . Not really, because we never got the "I think I am going to be sick type of downside panic hour" so often associated with selling climax lows. (It did, however, come on day 18 of the envisioned 17 - 25 session 'selling stampede', so the timing was right); we recommended committing a modicum of capital to stock— so far, so good.
So where does this leave us? Well, the equity markets strung together three or more "up" sessions, indicating that the selling stampede is over. And, as long as those lows hold (11971 closing and/or 11634 intraday), we still have a chance of a good rally. Worrisome is the fact that there is a ubiquitous feeling that any downside retest of those lows will be successful and consequently should be bought.
While we are hopeful that will be the case, if those lows don’t hold, we will be at the point of capitulation where participants throw in the towel and walk away. We are also at the point where you are going to hear whispers about a friend being in financial trouble due to too much debt. Recall it was the January 4th employment report that accelerated the stock slide into a selling stampede, which we said would likely extend until the State of the Union address.
In the meantime, one theme we are certain of is "yield." The retiring baby boomers want yield in their retirement years combined with an adequate rate of return. This is consistent with Benjamin Graham’s definition of an investment operation, which reads, "An investment operation is one which, upon thorough analysis, promises safety of principal and an adequate return. Operations not meeting these requirements are speculative."
With interest rates near historic lows, bonds may satisfy the "safety of principal" requirement, but it is doubtful they will provide an "adequate return." The burgeoning demand by the "boomers" for yield should provide support for select dividend-paying stocks. One such name for your consideration is 7.5% yielding EV Energy Partners (EVEP/$30.01 /Outperform).
The call for this week: The question du jour is, "Will the rate cuts, combined with the economic stimulus package, be enough to prevent the normal ending to the business cycle even if this is not your father’s typical recession?" Evidentially, the D-J Transports think so given their current rally mode! Yet even if successful, the nation faces a painful deleveraging process that will take time. As John Stuart Mill wrote in 1867, "Panics do not destroy capital; they merely reveal the extent to which it has been previously destroyed into hopelessly unproductive works."

Click Here, or on the image, to see a larger, undistorted image.

Click Here, or on the image, to see a larger, undistorted image.
"Foretold is Forewarned"
Ever since the successful downside retest of the August 2007 "lows" that occurred in late November, we have repeatedly stated that while we remained constructive on stocks into year-end 2007, we were entering 2008 in a cautious mode. We reiterated that caution the first week of January when we said:
|
Regrettably, those employment numbers were ugly and we went on to warn participants that the stock slide was taking on the characteristics of a "selling stampede." As often stated in these missives, "selling stampedes", and/or "buying stampedes", typically last 17 to 25 sessions with only one— to three-day counter trend "pauses" before they exhaust themselves.
It just seems to be the rhythm of the thing in that it takes participants that long to either get bearish enough, or bullish enough, to capitulate; and, in the current case, "cough up" their stocks. While it is true a few stampedes have lasted 25 to 30 sessions, it is RARE to have one extend for more than 30 sessions.
Meanwhile, the "selling stampede," combined with softening economic statistics, has caused the politicians to spring into action with what looks to us like another ill-fated scheme to ward off the normal business cycle. Recall, it was on December 6, 2007 that the President’s last scheme debuted. Titled operation "Hope Now," it was designed to stop mortgage interest rates from resetting to higher levels and was supposed to help hundreds of thousands of mortgage holders. According to Barron’s, however, it has helped less than one hundred mortgagees to date.
Last week’s proposed "scheme" was a $145 billion economic-stimulus package, which is expected to contain hundreds of dollars of tax-rebates per taxpayer, as well as tax breaks to encourage businesses to buy new equipment. It seems to us that this scheme is also flawed since the current problems stem from too much debt. If so, recipients of the tax rebates will probably use them to pay down existing debts rather than spend them and stimulate the economy. As the President unveiled the plan, we found ourselves screaming at the TV screen, "Don’t you realize that trying to prevent the inevitable conclusion of the business cycle (read: recession) a few years ago is exactly what got us into the present predicament?!"
Clearly the Federal Reserve, like the politicos, is worried given Mr. Bernanke’s comments last week. Yet if the overspent, undersaved American consumer is finally sated with debt, the Fed could be "pushing on a string" by lowering interest rates. Further, the Fed may just be in a "box," for as Milton Friedman noted, "a central bank can control its exchange rates; it can control its money supply growth rate; or it can control its interest rate; but, it cannot control all three at the same time!"
However, ISI’s Ed Hyman framed the problem differently when he recently wrote, "Here’s the problem. If we have a U.S. recession, even a mild one, developing economies are likely to slow. U.S. unemployment is likely to rise above 5.5%. Developing economies are likely to dump goods on world markets. [And] All of this could launch protectionist legislation that would lead to the end."
Indeed, for many months we have railed against the increasing traction protectionism, intervention, and over-regulation are gaining inside the D.C. Beltway. The question thus becomes, "does growth collapse from here because of the weight of the credit crunch, or not?"
As the astute GaveKal organization opines,
|
To this point, it is worth considering that if congress approves the recently proposed defense spending plan, which calls for tens of billions of increased spending, it should spread massive amounts of dollars to small/medium businesses whose multiplier effect could go a long way in avoiding a recession. This is another reason we have been unwaveringly bullish on government IT, defense, and the homeland security complex for the past number of years. Most recently, we have turned constructive on the shares of Strong Buy-rated Cogent (COGT/$9.19).
With more than 500,000 aliens entering the U.S. every year the authorities need a 99.9% accurate fingerprint reading in less than 30 seconds, which is one of the products Cogent manufactures. The company’s $5.00 per share in cash implies that we are buying the rest of the company for $4.19 a share. If our analyst is correct, Cogent should earn $0.55 per share in 2009, meaning we are buying the shares at less than 10 times forward earnings (ex-cash per share). Since 2008 is a great product pipeline year, as well as a potentially favorable contract "win" year, we think the risk/reward ratio is right for investors.
To be sure, we continue to like the Government IT and Homeland Security themes. Still, the government service stocks have tumbled ~ 8% in January due to the broad market decline and in-line with the seasonal trading patterns seen in the group. Due to the sell-off, our sense is the group looks more attractive than it has in quite some time. Moreover, we think investors are beginning to look for investments that are acyclical to the broader market concerns surrounding the consumer, energy prices, subprime exposure, and housing problems. Given the current valuation, fundamentals, and lack of a fundamental correlation to the overall market, we believe the government services group can outperform the broader markets in 2008. In addition to Cogent, we see value in Stanley (SXE/$28.31/Outperform) and NCI (NCIT/$15.31/Outperform).
As for our Canadian jaunt recently, western Canada is "booming!" In Edmonton every other street was littered with signs proclaiming "help wanted!" This labor demand has occurred even in light of the new increased royalty-regime legislated by Alberta’s politicians. Clearly we over-reacted to said regime, but while we have not invested any new capital in Alberta since that regime decision, we have held our remaining "long" stock positions in the Abathasca Tar Sands companies. We remain bullish on Canada, consistent with our "stuff stock" theme; and don’t look now, but a headline in a British Columbia newspaper read, "B.C. Energy Shortfall Looming," which was a direct reference to the money that needs to be spent to upgrade B.C.’s electric infrastructure.
The call for this week: Last week Treasury Secretary Paulson, when referring to the potential economic stimulus plan, averred, "This is not an emergency. There is an urgent need." To which we ask, "If this is NOT an emergency, then why is it urgent?!" Clearly the politicos are worried about a recession and are pulling out all the "stops" to prevent the normal business cycle once again. While we don’t think the recession question will be answered for months, we do think the selling stampede is definitely at an end and suggest getting your "buy list" together for at least a trade and maybe something more. It will be interesting to see if, like us, the street interprets the Fed's January moves as "panic" [[they did: normxxx]]. Whatever the outcome, we think a change for the better is approaching and are busy readying accounts accordingly. And that’s the way it is! So get ready, get set….
Normxxx
______________
The contents of any third-party letters/reports above do not necessarily reflect the opinions or viewpoint of normxxx. They are provided for informational/educational purposes only.
The content of any message or post by normxxx anywhere on this site is not to be construed as constituting market or investment advice. Such is intended for educational purposes only. Individuals should always consult with their own advisors for specific investment advice.
Portfolio Construction
A Logical Approach To Portfolio Construction
By John Riley, Chief Strategist, Cornerstone | 15 February 2008
We start simply, by asking ourselves questions. We build the portfolio by first looking at long term trends, then intermediate trends and last, short term.
 What are the overall long term trends?
The US stock market— With the potential for [[probability of: normxxx]] earnings disappointments and a slowing economy, the long term trend (several years) for the stock market is down. The economy will likely be held back by the still unfolding housing collapse, [[the credit/banking collapse: normxxx]], a retreat of consumers and rising unemployment. This should impact earnings negatively and send the market to levels not seen in a decade.
Strategy— Avoid US equities, sell into rallies. Invest in "bear market" funds or market hedges, such as several of the ETFs available that invest in the short side. This gives us our first piece of the asset allocation pie: Market Hedges
Inflation— What is the current environment? Are prices for goods and services rising or falling? This can be confusing sometimes because both can be happening at once. On the one hand, the cost of raw materials and labor costs are rising for the major manufacturers, but at the same time, foreign competition is forcing prices to the consumer down, squeezing profits.
 Inflation in raw materials is a function of foreign consumption. This is a trend that is not likely to slow down any time soon. They have tasted capitalism and they like it. Millions of people will be migrating from rural areas in the 3rd world to more urban areas and along with that comes an almost geometric increase in the consumption of raw materials.
Strategy— The obvious answer is commodities and natural resources companies, especially oil. At various times the shift within the sector will go from food to base metals to industrial materials to oil and so on. But in general, this group has the biggest bullish push on it of any sector, with an expected bull market run that could last many years if not decades. Investing in natural resources, commodities and raw material companies is the next piece of the pie.
 Lower interest rates— This is an interesting one. Lower short term interest rates does not mean lower long term interest rates. In fact, low short term interest rates does not mean a healthy economy. Interest rates in the 1930’s were at or near zero and the economy was still depressed. In Japan for the past 15 years, they have been going through a deflationary funk that interest rates at zero percent could not fix. Why are low interest rates likely not to help the economy? Because of too much debt. Almost every sector of the economy, from the government to the consumer is loaded down with [[paying off: normxxx]] record debt levels.
Strategy— As the Fed cranks up the presses to print more Dollars, the US Dollar is diluted and devalued. The best way to hedge the declining Dollar is to own the opposite asset. Foreign Debt and Gold [[and since most foreign countries soon will be racing us to the bottom, that leaves...: normxxx]]. See Cycle of Deflation.
 Growing Trade Deficit— With the potential for declining earnings domestically and the continual growth of the trade deficit, foreign companies may pick up the slack for growth. Opportunities may be presenting themselves for foreign companies to do more business with each other as America’s share of the Global GDP continues to shrink.
Strategy— Owning International Equities may be a better source of equity growth compared to US stocks for the next several years.
 Geo-Political Tensions– With the world the way it is today, war in the Middle East, hot spots in Asia, a recalcitrant Russia, and growing tensions in South America, a surprise, war or terrorism should be expected.
Strategy— Having some assets as a safe haven is important. Cash is king for this when it comes to principal safety and Treasuries are a place money runs to when there is global trouble. Since we are concerned with inflation, TIPs (Treasury Inflation Protection Securities) fill the bill here.
 Momentum— The boys on Wall Street still control the game. They have defied the odds for years. The market should have had a correction years ago. The rally within a bear market that started in 2003 has gone on for much longer than most expected.
Strategy— Humility is important. No matter how right the evidence and statistics are, momentum can still carry the market higher in the face of terrible news or lower in the face of great news. Having a balanced fund in the portfolio gives the investor a piece of what the boys on Wall street are doing.
 Market Rallies— Regardless of the market conditions, even in the worst bear markets, there are always rallies. And many of them are tradable rallies. In most cases, investors should sell into rallies. But once the asset allocation is set, investors can take advantage of the rallies.
Strategy— Always be prepared to trade. Not day trade, but take advantage of mis-priced securities, whatever they may be, whether they are stocks, bonds or whatever.
Allocation
Now that we have the assets picked, next is the allocation part. This is determined by how much risk the investor is willing to accept and how much of an impact the asset class is likely to have. We are constantly adjusting the allocation of the portfolio to take advantage of the shifting sands of the market place and economy. We tend to look at intermediate and short term trends when adjusting our allocation.
What are the intermediate trends? These could be an acceleration of the long term trend or counter trends to the long term. If an asset class has gone too far too fast, we may reduce our allocation in anticipation of a pullback. For instance, if oil were to race up to $120/bbl in the next two weeks based on tensions in the Middle East, we would be ready to cut our Natural Resources allocation. We would then increase it again after a significant pullback.
Short term opportunities could include trades and taking advantage of anticipated news. If it were expected that more banks were going to report huge losses due to sub-prime, we might increase our hedges specifically in the financial area. Or if some bad news came out for a stock that had been a consistent performer, and the stock dropped quickly, we might use that as an opportunity to trade, [[e.g., to buy, unless, 1) you figure the bad news will affect earnings for several years, or 2) it is hardly directly related to the company, and you believe you have a head start on the slower witted— warning: this is rarely true if the stock has already reacted, and, be humble, your 'long chain of consequences' may be only in your mind): normxxx]].
The strategy is fully flexible. In other words, if it appeared that the US market had become a good value again, asset allocation would then be adjusted to include US asset classes. Do not lock yourself into a certain pre-determined minimum or maximum percentage on any asset class. Asset Allocation is also not static. It needs constant monitoring and adjusting. In the current and foreseeable market and economic conditions, the old buy n’ hold mentality of the 90’s will not work. But if this logical approach to portfolio construction is something you agree with, then disciplined money management may be for you.
ߧ
Normxxx
______________
The contents of any third-party letters/reports above do not necessarily reflect the opinions or viewpoint of normxxx. They are provided for informational/educational purposes only.
The content of any message or post by normxxx anywhere on this site is not to be construed as constituting market or investment advice. Such is intended for educational purposes only. Individuals should always consult with their own advisors for specific investment advice.
By John Riley, Chief Strategist, Cornerstone | 15 February 2008
|
We start simply, by asking ourselves questions. We build the portfolio by first looking at long term trends, then intermediate trends and last, short term.
What are the overall long term trends?The US stock market— With the potential for [[probability of: normxxx]] earnings disappointments and a slowing economy, the long term trend (several years) for the stock market is down. The economy will likely be held back by the still unfolding housing collapse, [[the credit/banking collapse: normxxx]], a retreat of consumers and rising unemployment. This should impact earnings negatively and send the market to levels not seen in a decade.
Strategy— Avoid US equities, sell into rallies. Invest in "bear market" funds or market hedges, such as several of the ETFs available that invest in the short side. This gives us our first piece of the asset allocation pie: Market Hedges
Inflation— What is the current environment? Are prices for goods and services rising or falling? This can be confusing sometimes because both can be happening at once. On the one hand, the cost of raw materials and labor costs are rising for the major manufacturers, but at the same time, foreign competition is forcing prices to the consumer down, squeezing profits.
Inflation in raw materials is a function of foreign consumption. This is a trend that is not likely to slow down any time soon. They have tasted capitalism and they like it. Millions of people will be migrating from rural areas in the 3rd world to more urban areas and along with that comes an almost geometric increase in the consumption of raw materials.Strategy— The obvious answer is commodities and natural resources companies, especially oil. At various times the shift within the sector will go from food to base metals to industrial materials to oil and so on. But in general, this group has the biggest bullish push on it of any sector, with an expected bull market run that could last many years if not decades. Investing in natural resources, commodities and raw material companies is the next piece of the pie.
Lower interest rates— This is an interesting one. Lower short term interest rates does not mean lower long term interest rates. In fact, low short term interest rates does not mean a healthy economy. Interest rates in the 1930’s were at or near zero and the economy was still depressed. In Japan for the past 15 years, they have been going through a deflationary funk that interest rates at zero percent could not fix. Why are low interest rates likely not to help the economy? Because of too much debt. Almost every sector of the economy, from the government to the consumer is loaded down with [[paying off: normxxx]] record debt levels.Strategy— As the Fed cranks up the presses to print more Dollars, the US Dollar is diluted and devalued. The best way to hedge the declining Dollar is to own the opposite asset. Foreign Debt and Gold [[and since most foreign countries soon will be racing us to the bottom, that leaves...: normxxx]]. See Cycle of Deflation.
Growing Trade Deficit— With the potential for declining earnings domestically and the continual growth of the trade deficit, foreign companies may pick up the slack for growth. Opportunities may be presenting themselves for foreign companies to do more business with each other as America’s share of the Global GDP continues to shrink.Strategy— Owning International Equities may be a better source of equity growth compared to US stocks for the next several years.
Geo-Political Tensions– With the world the way it is today, war in the Middle East, hot spots in Asia, a recalcitrant Russia, and growing tensions in South America, a surprise, war or terrorism should be expected.Strategy— Having some assets as a safe haven is important. Cash is king for this when it comes to principal safety and Treasuries are a place money runs to when there is global trouble. Since we are concerned with inflation, TIPs (Treasury Inflation Protection Securities) fill the bill here.
Momentum— The boys on Wall Street still control the game. They have defied the odds for years. The market should have had a correction years ago. The rally within a bear market that started in 2003 has gone on for much longer than most expected.Strategy— Humility is important. No matter how right the evidence and statistics are, momentum can still carry the market higher in the face of terrible news or lower in the face of great news. Having a balanced fund in the portfolio gives the investor a piece of what the boys on Wall street are doing.
Market Rallies— Regardless of the market conditions, even in the worst bear markets, there are always rallies. And many of them are tradable rallies. In most cases, investors should sell into rallies. But once the asset allocation is set, investors can take advantage of the rallies.Strategy— Always be prepared to trade. Not day trade, but take advantage of mis-priced securities, whatever they may be, whether they are stocks, bonds or whatever.
Allocation
Now that we have the assets picked, next is the allocation part. This is determined by how much risk the investor is willing to accept and how much of an impact the asset class is likely to have. We are constantly adjusting the allocation of the portfolio to take advantage of the shifting sands of the market place and economy. We tend to look at intermediate and short term trends when adjusting our allocation.
What are the intermediate trends? These could be an acceleration of the long term trend or counter trends to the long term. If an asset class has gone too far too fast, we may reduce our allocation in anticipation of a pullback. For instance, if oil were to race up to $120/bbl in the next two weeks based on tensions in the Middle East, we would be ready to cut our Natural Resources allocation. We would then increase it again after a significant pullback.
Short term opportunities could include trades and taking advantage of anticipated news. If it were expected that more banks were going to report huge losses due to sub-prime, we might increase our hedges specifically in the financial area. Or if some bad news came out for a stock that had been a consistent performer, and the stock dropped quickly, we might use that as an opportunity to trade, [[e.g., to buy, unless, 1) you figure the bad news will affect earnings for several years, or 2) it is hardly directly related to the company, and you believe you have a head start on the slower witted— warning: this is rarely true if the stock has already reacted, and, be humble, your 'long chain of consequences' may be only in your mind): normxxx]].
The strategy is fully flexible. In other words, if it appeared that the US market had become a good value again, asset allocation would then be adjusted to include US asset classes. Do not lock yourself into a certain pre-determined minimum or maximum percentage on any asset class. Asset Allocation is also not static. It needs constant monitoring and adjusting. In the current and foreseeable market and economic conditions, the old buy n’ hold mentality of the 90’s will not work. But if this logical approach to portfolio construction is something you agree with, then disciplined money management may be for you.
ߧ
Normxxx
______________
The contents of any third-party letters/reports above do not necessarily reflect the opinions or viewpoint of normxxx. They are provided for informational/educational purposes only.
The content of any message or post by normxxx anywhere on this site is not to be construed as constituting market or investment advice. Such is intended for educational purposes only. Individuals should always consult with their own advisors for specific investment advice.
The Real P/E Ratio?
February 2008 - What Is The Real P/E Ratio?
By The Comstock Partners, Inc. | 21 February 2008
There has been a lot of discussion about the correct way to measure valuations in the stock market. Comstock, in fact, wrote a piece published in Barron’s magazine a few years ago about what we consider to be the correct way to measure under or over valuation of the stock market. We now see that the confusion is worse than ever, and we will try to help clarify the issue with this "special report" on valuation metrics and explain why we believe that the stock market is extremely overvalued and will continue to decline to much lower levels on the major indices.
There is a section on our home page called "Limbo, Limbo— How Low Can It Go?" which we would encourage you to use to determine how low you think it can go by plugging in your own earnings estimate for 2008 and multiplying that number by the P/E ratio you expect the S&P 500 to sell at when the market reaches its low point or close to its low point.
If you watch and listen to the business news enough you must be getting very confused about whether the stock market is undervalued or overvalued. The bulls who appear on these financial shows assert that the stock market is inexpensive or cheap. They typically say, "This market is as cheap as it has been for the past 2 decades— or the past 18 years". They could also state that the P/E ratio is below the norm over very long periods of time at 14-15 times earnings. Actually, their statements are correct, but they are accurate only because they are using debatable earnings.
At other times during the same day you may hear a bearish market maven try to convince the interviewer that the market is substantially overvalued and has a long way to go on the downside before it gets to fair valuation. The bearish interviewee will either discuss why the P/E ratio at over 20 times 2008 earnings estimates or 19 times the latest 12 months earnings are closer to valuations near market tops than market bottoms and that the market is therefore highly vulnerable. Believe it or not, these analysts are also correct.
If the bearish analyst really wanted to pursue a more sophisticated way of explaining the overvaluation, he or she may discuss why trendline earnings (or smoothed earnings) are the best way to measure valuation and using that method the market is extremely overvalued. (We will get into smoothed earnings at the end of this report— but right now we will keep this simple.) The interviewer seldom if ever questions the disparity in the various market mavens approach to valuation. Let’s see if we can clear this up.
Essentially, few organizations are equipped to estimate the earnings of every company in the Standard and Poor’s 500 since it would require having analysts in every sector to study each individual stock and come up with the best guess possible. Because virtually no institution or money management firm does this themselves, we generally rely on organizations such as Standard & Poor’s to do the work for us.
If you go into the website at http://www2.standardandpoors.com/spf/xls/index/SP500EPSEST.XLS you will find a myriad of different earnings estimates from which you can choose. They show Reported Earnings, Operating Earnings, Core Earnings, Pension Interest Adjustment, and other earnings from which you can select. Rather than discuss all these different earnings numbers used by S&P, let’s just discuss the two main earnings numbers that Wall Street, in general, uses when discussing valuations. They either take the "reported earnings" or "operating earnings".
Typically, the bulls use "operating earnings" and the bears use "reported earnings" because operating earnings are higher and reported earnings are lower. Also, it makes sense for the bears to use the last 12 months of earnings because they are usually lower and the bulls use forward operating earnings to help make their case. The only difference in the two main earnings estimates used is that operating earnings exclude "write-offs" while reported earnings include "write-offs". That is the only difference!!! If you scroll down to the early 1990s on the S&P website you will see that the earnings and PE on both operating and reported earnings were virtually the same. But then we entered the greatest financial mania of all time in the late 1990s (including many write-offs) and the earnings numbers diverged.
Generally Deceptive Accounting Practices
There were so many "write-offs" by companies making unwise investments that operating earnings grew much faster than reported earnings [[also, companies were quick to note that most investors ignored "write-offs": normxxx]]. We will get to what these earnings numbers are presently in the next paragraph. But now, let’s try to use some common sense in determining which of the two earnings numbers make the most sense. Do you think that using "operating earnings" which EXCLUDE "write-offs" are the more reasonable numbers to use or "reported earnings" which are GAAP (Generally Accepted Accounting Practices) approved?
Comstock uses GAAP approved "reported earnings" because the "write offs" that were sporadic and unusual became common practice for many companies. Last year’s and this year’s Collateralized Debt Obligations (CDOs) are examples of poor investments that had to be "written off", and it’s hard to conceive of investors believing that these "write offs" should be excluded from earnings. Using "operating earnings" would be akin to playing in a major golf tournament that doesn’t count any penalty strokes for hitting the ball in a hazard or out of bounds.
Now let’s look at the numbers!! The "reported earnings" for 2007 were just under $73 while the "operating earnings" for 2007 were just over $84. The estimated numbers for 2008 are just under $100 for the "operating earnings" and just under $68 for the "reported earnings". By the way, these reported numbers have just recently been drastically revised downward due to the slowdown in the US economy.
Now you can see why there is such discrepancy in the market mavens’ point of view. If you are a bull you will say the market is trading at a very reasonable 14 multiple on the $98 of earnings in 2008. On the other hand if you are a bear or just a reasonable person you can see the market is trading at 19 times trailing earnings and about 20 times 2008 "reported earnings".
Now, whether you agree with the bulls, or us, we suggest that you click on "Limbo, Limbo-How Low Can It Go" on our home page and plug in the numbers you believe to be the most logical. As you can see in the NDR (Ned Davis Research) 75 year chart most of the market peaks topped at around 20 times earnings (until the financial mania) and the troughs occurred at around 10 times earnings (also until the financial mania). You should concentrate on the bottom clip of these charts on historical P/Es, but notice NDR also uses the same earnings as S&P.
Unless you believe that we will be trading at a "permanent plateau" as did the noted economist, Dr. Irving Fisher in 1929, you might want to consider the more distant peak and trough multiples. If you think we are going into a recession as we do (we are probably already in one) you might want to plug in a number on the low side or use the S&P reported estimate of $67.90. However, to be consistent with the long term NDR chart on P/Es in "Limbo, Limbo" you should use the last 12 months of $72.86. If you are a bull, I am sure you will want to use the forward "operating earnings" of $97.99.
Regardless of the number you plug in, you now have to come up with the P/E number you expect to see at the market bottom. We would suggest you take a look at all the historical market bottoms on the charts and determine just how bad this bear market could be in relationship to the other bear markets. The bears might want to use a P/E number of 10 or below to multiply times the earnings expected, while the bulls might want to use today’s P/E or higher and multiply by the earnings they expect.
Smoothed Or Trendline Earnings
Okay, this exercise has been fun and there is nothing wrong with the logic. However, if you really want to delve into an even better way of measuring valuation you should consider smoothed earnings. We will have to caution anyone who does not want to get a mind overload (which might require psychological help) to skip this section of the report. We will try to make this as simple as possible.
The best way to measure present earnings and future earnings is to smooth them out over long periods of time. The reason for this is that earnings can only grow at approximately 6% a year over the long term since it is limited by the growth in real GDP plus inflation— in other words, nominal GDP. Long term, real GDP cannot grow faster than the increase in the labor force plus productivity. Even if you don’t accept this premise, all you have to do is look at a long-term chart of earnings and draw a 6% growth line thru the earnings points and you will see how well it fits.
When you have an earnings chart like the NDR chart attached, you can see the variations above and below the 6% line. Since, it is clear that the earnings sometimes rise above the line and sometimes fall below the line, it is clear that earnings will revert to the mean of the 6% line. When earnings are rising above the line it is usually because of an increase in the margins of a certain sector of the economy that is not sustainable and if they fall below the line, it is usually because of a recession or a credit crunch.
The main point we are attempting to make is that trendline earnings (or smoothed earnings) are actually a better measure of valuation than the actual reported earnings of the S&P or any other estimate. For long-term readers of Comstock you know we prefer to smooth the earnings of the S&P 500 with a 9-year average to accomplish an even more accurate way to evaluate true earnings over time. Attached is the latest chart of the smoothed earnings discussed in this report. You can see from the chart going back to 1950 that every instance where actual earnings rose above trendline earnings was followed by a period where actual earnings went well below trendline earnings. We believe we have entered such a latter period now.
However, just as we would have advised you to use trendline earnings when actual earnings were above the trendline, we would continue to use trendline earnings when actual earnings fall below trendline earnings. Since trendline earnings are about $70 now, we would continue to use that number for all of 2008 (regardless of where actual earnings decline to in the recession) to multiply times the P/E you expect at the market bottom for valuation purposes. Since we expect the market to bottom at around 10 times earnings or less, the market has a long way to go on the downside if we are correct.
Ned Davis Operating Earnings
Ned Davis Reported Earnings
Ned Davis Earnings Growth
The Chart Store Actual vs Trendline Earnings
ߧ
Normxxx
______________
The contents of any third-party letters/reports above do not necessarily reflect the opinions or viewpoint of normxxx. They are provided for informational/educational purposes only.
The content of any message or post by normxxx anywhere on this site is not to be construed as constituting market or investment advice. Such is intended for educational purposes only. Individuals should always consult with their own advisors for specific investment advice.
By The Comstock Partners, Inc. | 21 February 2008
There has been a lot of discussion about the correct way to measure valuations in the stock market. Comstock, in fact, wrote a piece published in Barron’s magazine a few years ago about what we consider to be the correct way to measure under or over valuation of the stock market. We now see that the confusion is worse than ever, and we will try to help clarify the issue with this "special report" on valuation metrics and explain why we believe that the stock market is extremely overvalued and will continue to decline to much lower levels on the major indices.
There is a section on our home page called "Limbo, Limbo— How Low Can It Go?" which we would encourage you to use to determine how low you think it can go by plugging in your own earnings estimate for 2008 and multiplying that number by the P/E ratio you expect the S&P 500 to sell at when the market reaches its low point or close to its low point.
If you watch and listen to the business news enough you must be getting very confused about whether the stock market is undervalued or overvalued. The bulls who appear on these financial shows assert that the stock market is inexpensive or cheap. They typically say, "This market is as cheap as it has been for the past 2 decades— or the past 18 years". They could also state that the P/E ratio is below the norm over very long periods of time at 14-15 times earnings. Actually, their statements are correct, but they are accurate only because they are using debatable earnings.
At other times during the same day you may hear a bearish market maven try to convince the interviewer that the market is substantially overvalued and has a long way to go on the downside before it gets to fair valuation. The bearish interviewee will either discuss why the P/E ratio at over 20 times 2008 earnings estimates or 19 times the latest 12 months earnings are closer to valuations near market tops than market bottoms and that the market is therefore highly vulnerable. Believe it or not, these analysts are also correct.
If the bearish analyst really wanted to pursue a more sophisticated way of explaining the overvaluation, he or she may discuss why trendline earnings (or smoothed earnings) are the best way to measure valuation and using that method the market is extremely overvalued. (We will get into smoothed earnings at the end of this report— but right now we will keep this simple.) The interviewer seldom if ever questions the disparity in the various market mavens approach to valuation. Let’s see if we can clear this up.
Essentially, few organizations are equipped to estimate the earnings of every company in the Standard and Poor’s 500 since it would require having analysts in every sector to study each individual stock and come up with the best guess possible. Because virtually no institution or money management firm does this themselves, we generally rely on organizations such as Standard & Poor’s to do the work for us.
If you go into the website at http://www2.standardandpoors.com/spf/xls/index/SP500EPSEST.XLS you will find a myriad of different earnings estimates from which you can choose. They show Reported Earnings, Operating Earnings, Core Earnings, Pension Interest Adjustment, and other earnings from which you can select. Rather than discuss all these different earnings numbers used by S&P, let’s just discuss the two main earnings numbers that Wall Street, in general, uses when discussing valuations. They either take the "reported earnings" or "operating earnings".
Typically, the bulls use "operating earnings" and the bears use "reported earnings" because operating earnings are higher and reported earnings are lower. Also, it makes sense for the bears to use the last 12 months of earnings because they are usually lower and the bulls use forward operating earnings to help make their case. The only difference in the two main earnings estimates used is that operating earnings exclude "write-offs" while reported earnings include "write-offs". That is the only difference!!! If you scroll down to the early 1990s on the S&P website you will see that the earnings and PE on both operating and reported earnings were virtually the same. But then we entered the greatest financial mania of all time in the late 1990s (including many write-offs) and the earnings numbers diverged.
Generally Deceptive Accounting Practices
There were so many "write-offs" by companies making unwise investments that operating earnings grew much faster than reported earnings [[also, companies were quick to note that most investors ignored "write-offs": normxxx]]. We will get to what these earnings numbers are presently in the next paragraph. But now, let’s try to use some common sense in determining which of the two earnings numbers make the most sense. Do you think that using "operating earnings" which EXCLUDE "write-offs" are the more reasonable numbers to use or "reported earnings" which are GAAP (Generally Accepted Accounting Practices) approved?
Comstock uses GAAP approved "reported earnings" because the "write offs" that were sporadic and unusual became common practice for many companies. Last year’s and this year’s Collateralized Debt Obligations (CDOs) are examples of poor investments that had to be "written off", and it’s hard to conceive of investors believing that these "write offs" should be excluded from earnings. Using "operating earnings" would be akin to playing in a major golf tournament that doesn’t count any penalty strokes for hitting the ball in a hazard or out of bounds.
Now let’s look at the numbers!! The "reported earnings" for 2007 were just under $73 while the "operating earnings" for 2007 were just over $84. The estimated numbers for 2008 are just under $100 for the "operating earnings" and just under $68 for the "reported earnings". By the way, these reported numbers have just recently been drastically revised downward due to the slowdown in the US economy.
Now you can see why there is such discrepancy in the market mavens’ point of view. If you are a bull you will say the market is trading at a very reasonable 14 multiple on the $98 of earnings in 2008. On the other hand if you are a bear or just a reasonable person you can see the market is trading at 19 times trailing earnings and about 20 times 2008 "reported earnings".
Now, whether you agree with the bulls, or us, we suggest that you click on "Limbo, Limbo-How Low Can It Go" on our home page and plug in the numbers you believe to be the most logical. As you can see in the NDR (Ned Davis Research) 75 year chart most of the market peaks topped at around 20 times earnings (until the financial mania) and the troughs occurred at around 10 times earnings (also until the financial mania). You should concentrate on the bottom clip of these charts on historical P/Es, but notice NDR also uses the same earnings as S&P.
Unless you believe that we will be trading at a "permanent plateau" as did the noted economist, Dr. Irving Fisher in 1929, you might want to consider the more distant peak and trough multiples. If you think we are going into a recession as we do (we are probably already in one) you might want to plug in a number on the low side or use the S&P reported estimate of $67.90. However, to be consistent with the long term NDR chart on P/Es in "Limbo, Limbo" you should use the last 12 months of $72.86. If you are a bull, I am sure you will want to use the forward "operating earnings" of $97.99.
Regardless of the number you plug in, you now have to come up with the P/E number you expect to see at the market bottom. We would suggest you take a look at all the historical market bottoms on the charts and determine just how bad this bear market could be in relationship to the other bear markets. The bears might want to use a P/E number of 10 or below to multiply times the earnings expected, while the bulls might want to use today’s P/E or higher and multiply by the earnings they expect.
Smoothed Or Trendline Earnings
Okay, this exercise has been fun and there is nothing wrong with the logic. However, if you really want to delve into an even better way of measuring valuation you should consider smoothed earnings. We will have to caution anyone who does not want to get a mind overload (which might require psychological help) to skip this section of the report. We will try to make this as simple as possible.
The best way to measure present earnings and future earnings is to smooth them out over long periods of time. The reason for this is that earnings can only grow at approximately 6% a year over the long term since it is limited by the growth in real GDP plus inflation— in other words, nominal GDP. Long term, real GDP cannot grow faster than the increase in the labor force plus productivity. Even if you don’t accept this premise, all you have to do is look at a long-term chart of earnings and draw a 6% growth line thru the earnings points and you will see how well it fits.
When you have an earnings chart like the NDR chart attached, you can see the variations above and below the 6% line. Since, it is clear that the earnings sometimes rise above the line and sometimes fall below the line, it is clear that earnings will revert to the mean of the 6% line. When earnings are rising above the line it is usually because of an increase in the margins of a certain sector of the economy that is not sustainable and if they fall below the line, it is usually because of a recession or a credit crunch.
The main point we are attempting to make is that trendline earnings (or smoothed earnings) are actually a better measure of valuation than the actual reported earnings of the S&P or any other estimate. For long-term readers of Comstock you know we prefer to smooth the earnings of the S&P 500 with a 9-year average to accomplish an even more accurate way to evaluate true earnings over time. Attached is the latest chart of the smoothed earnings discussed in this report. You can see from the chart going back to 1950 that every instance where actual earnings rose above trendline earnings was followed by a period where actual earnings went well below trendline earnings. We believe we have entered such a latter period now.
However, just as we would have advised you to use trendline earnings when actual earnings were above the trendline, we would continue to use trendline earnings when actual earnings fall below trendline earnings. Since trendline earnings are about $70 now, we would continue to use that number for all of 2008 (regardless of where actual earnings decline to in the recession) to multiply times the P/E you expect at the market bottom for valuation purposes. Since we expect the market to bottom at around 10 times earnings or less, the market has a long way to go on the downside if we are correct.
Ned Davis Operating Earnings
Ned Davis Reported Earnings
Ned Davis Earnings Growth
The Chart Store Actual vs Trendline Earnings
|

ߧ
Normxxx
______________
The contents of any third-party letters/reports above do not necessarily reflect the opinions or viewpoint of normxxx. They are provided for informational/educational purposes only.
The content of any message or post by normxxx anywhere on this site is not to be construed as constituting market or investment advice. Such is intended for educational purposes only. Individuals should always consult with their own advisors for specific investment advice.
Wednesday, February 27, 2008
Short Sales In SoCal
Short Sale Report Volume 4: 16,646 Short Sales In Southern California.
By Dr. Housing Bubble | 22 February 2008
I prefer to take economic data and information like I take my sushi, raw with wasabi. In October, we reported the monumental tipping point of going over 10,000 short sales in Southern California. Those days now seem like a distant reality since as of today, there are 16,646 short sales in the Southern California housing market. There are a few graphs that we will be looking at in greater detail since these show the battle occurring in the housing trenches. Short sales are an important bellwether of the health in housing and until there is a slow-down in this area, we can put to rest any notion that we are even approaching bottom.
Also, there is this sudden notion that somehow we have been in the housing "slump" for ages and suddenly need to do every sort of bailout to keep housing prices sky high. Forget that housing has been on a tear for 10 years. It is as if there was no massive bubble and that even talking too much about 'the problem' is somehow going to make it worse. It may shift the market psychology a bit, but the reality is that you can’t make income appear out of thin air like David Copperfield. There lies the caveat. All this talk from politicians fails to address the fact that our current economy is based on large levels of conspicuous consumption and some major sector being in a bubble (housing having been merely the latest). Not something that bodes well for the future when the last bubble pops.
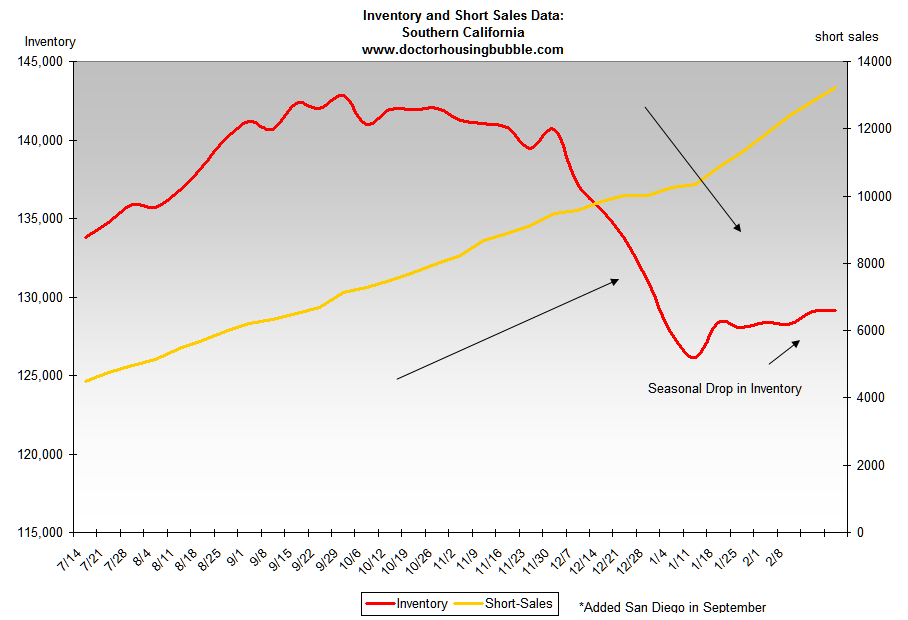
Click Here, or on the image, to see a larger, undistorted image.
The first graph shows inventory and short sales. As you can see, we are now out of the seasonal winter drop and inventory has been steadily increasing. Typically the peak in inventory numbers hits in spring and summer. Currently in Southern California we have 149,946 homes on the market. The chart above excludes San Diego inventory numbers since I do not have data beyond September but the short sale number does include San Diego numbers. According to DataQuick 9,983 homes sold in January. So let us do a bit of back of the napkin math:
Total SoCal Inventory (149,946) / Total Current SoCal Monthly Sales (9,983) = 15 Months
That’s right folks, we have over a year of inventory at the current sales rate, and take a look at the short sale inventory. This thing is increasing at exponential speed. There have been many studies discussing balanced sales figures but suffice it to say that 6 months of inventory is typically a balanced market for housing. We are nowhere close to that. Now let us take a look at another chart:
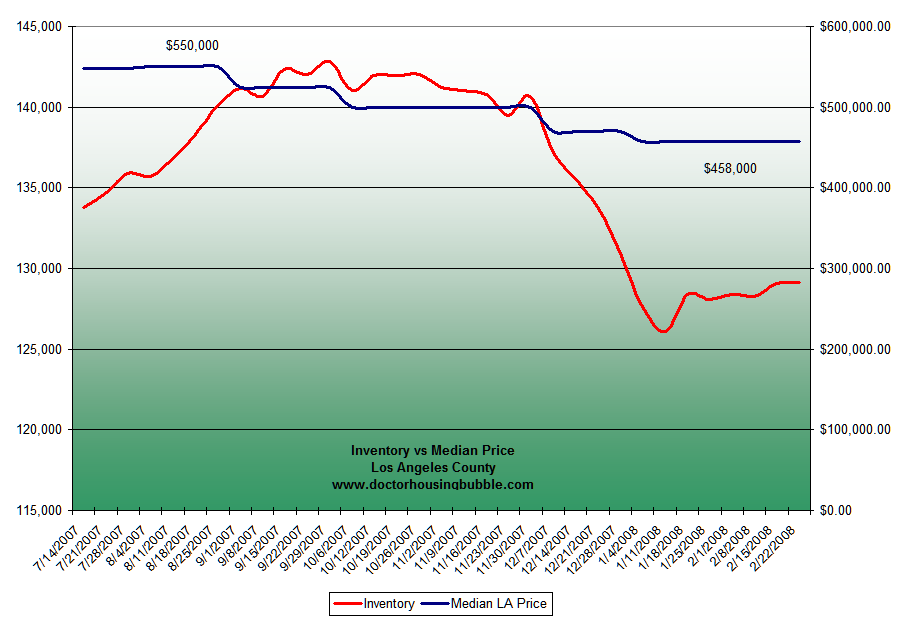
Click Here, or on the image, to see a larger, undistorted image.
This chart shows that from the peak of $550,000, Los Angeles County is now off its median peak by nearly $100,000. The importance of this chart is that it is an excellent predictor of where things will be heading. As you can see, inventory is increasing. Until inventory starts decreasing or sales start going through the roof, prices will not be going up. Aside from the credit crunch can it be that inventory is growing also because of reluctant sellers not realizing the reality of the current market? Are they swimming in a Freudian dream of housing delusion?
Do they not realize that California is in a $16 billion short fall and we are now using cockamamie ideas of balancing the budget such as closing schools (good for our future), firing teachers (higher unemployment), and letting out inmates (more home buyers!). The list of Real Homes of Genius only keeps expanding and the tide is now receding and we are going to be in housing purgatory for a very long time. The stories only get weirder and more complex as in any bubble. Greed makes people do absurd things. I recall reading a story about a farmer selling his entire livestock for a handful of tulip bulbs during that historical bubble only to realize that the one cow he kept snuck into his home at night and ate the entire tulip stock.
In this insane market we have to come to terms not only with high housing prices and defunct mortgage products, but we also have to admit that a majority of the population became speculators with the single biggest asset class in America whether they acknowledge it or not. This is a problem. First it was only a subprime thing. Then it was a subprime and credit market thing. Now it is a national emergency and every homeowner needs to be bailed out with Hope Now, Project Lifeline, Free Money Express, Wal-Mart Vouchers, 7-11 Ice Cream Relief, Mortgage Moratoriums, and every other Orwellian type of concoction you can think of. I won’t be surprised if some of these things fly since Americans are so addicted to credit they will fight tooth and nail once they realize they are maxed out.
Normxxx
______________
The contents of any third-party letters/reports above do not necessarily reflect the opinions or viewpoint of normxxx. They are provided for informational/educational purposes only.
The content of any message or post by normxxx anywhere on this site is not to be construed as constituting market or investment advice. Such is intended for educational purposes only. Individuals should always consult with their own advisors for specific investment advice.
By Dr. Housing Bubble | 22 February 2008
I prefer to take economic data and information like I take my sushi, raw with wasabi. In October, we reported the monumental tipping point of going over 10,000 short sales in Southern California. Those days now seem like a distant reality since as of today, there are 16,646 short sales in the Southern California housing market. There are a few graphs that we will be looking at in greater detail since these show the battle occurring in the housing trenches. Short sales are an important bellwether of the health in housing and until there is a slow-down in this area, we can put to rest any notion that we are even approaching bottom.
Also, there is this sudden notion that somehow we have been in the housing "slump" for ages and suddenly need to do every sort of bailout to keep housing prices sky high. Forget that housing has been on a tear for 10 years. It is as if there was no massive bubble and that even talking too much about 'the problem' is somehow going to make it worse. It may shift the market psychology a bit, but the reality is that you can’t make income appear out of thin air like David Copperfield. There lies the caveat. All this talk from politicians fails to address the fact that our current economy is based on large levels of conspicuous consumption and some major sector being in a bubble (housing having been merely the latest). Not something that bodes well for the future when the last bubble pops.
Click Here, or on the image, to see a larger, undistorted image.
The first graph shows inventory and short sales. As you can see, we are now out of the seasonal winter drop and inventory has been steadily increasing. Typically the peak in inventory numbers hits in spring and summer. Currently in Southern California we have 149,946 homes on the market. The chart above excludes San Diego inventory numbers since I do not have data beyond September but the short sale number does include San Diego numbers. According to DataQuick 9,983 homes sold in January. So let us do a bit of back of the napkin math:
Total SoCal Inventory (149,946) / Total Current SoCal Monthly Sales (9,983) = 15 Months
That’s right folks, we have over a year of inventory at the current sales rate, and take a look at the short sale inventory. This thing is increasing at exponential speed. There have been many studies discussing balanced sales figures but suffice it to say that 6 months of inventory is typically a balanced market for housing. We are nowhere close to that. Now let us take a look at another chart:
Click Here, or on the image, to see a larger, undistorted image.
This chart shows that from the peak of $550,000, Los Angeles County is now off its median peak by nearly $100,000. The importance of this chart is that it is an excellent predictor of where things will be heading. As you can see, inventory is increasing. Until inventory starts decreasing or sales start going through the roof, prices will not be going up. Aside from the credit crunch can it be that inventory is growing also because of reluctant sellers not realizing the reality of the current market? Are they swimming in a Freudian dream of housing delusion?
Do they not realize that California is in a $16 billion short fall and we are now using cockamamie ideas of balancing the budget such as closing schools (good for our future), firing teachers (higher unemployment), and letting out inmates (more home buyers!). The list of Real Homes of Genius only keeps expanding and the tide is now receding and we are going to be in housing purgatory for a very long time. The stories only get weirder and more complex as in any bubble. Greed makes people do absurd things. I recall reading a story about a farmer selling his entire livestock for a handful of tulip bulbs during that historical bubble only to realize that the one cow he kept snuck into his home at night and ate the entire tulip stock.
In this insane market we have to come to terms not only with high housing prices and defunct mortgage products, but we also have to admit that a majority of the population became speculators with the single biggest asset class in America whether they acknowledge it or not. This is a problem. First it was only a subprime thing. Then it was a subprime and credit market thing. Now it is a national emergency and every homeowner needs to be bailed out with Hope Now, Project Lifeline, Free Money Express, Wal-Mart Vouchers, 7-11 Ice Cream Relief, Mortgage Moratoriums, and every other Orwellian type of concoction you can think of. I won’t be surprised if some of these things fly since Americans are so addicted to credit they will fight tooth and nail once they realize they are maxed out.
Normxxx
______________
The contents of any third-party letters/reports above do not necessarily reflect the opinions or viewpoint of normxxx. They are provided for informational/educational purposes only.
The content of any message or post by normxxx anywhere on this site is not to be construed as constituting market or investment advice. Such is intended for educational purposes only. Individuals should always consult with their own advisors for specific investment advice.
Health Care In China
Health Care In China: Losing Patients
From The Economist Print Edition | 25 February 2008
Startling economic growth in China has not been matched by similar improvements in health care. The cost of treatment is becoming ever more prohibitive for the poor. Government spending is meagre. But nearly three years after declaring the system a failure, officials are at last getting ready to unveil a plan to fix it.
 It will cost them
Some Chinese press reports say the long-awaited and much-debated reform plan is likely to be revealed at the annual session of China's parliament, which opens on March 5th. The outline is already clear: a stronger role for government, including more money from the central budget, and a drive towards universal health insurance. Changes are already in train.
The reforms reverse the market-driven policies of much of the past two decades. The outbreak in 2003 of SARS, an often fatal respiratory disease, made the government realise what a mess the health-care system had become. Government hospitals and clinics, starved of funding, had turned to raising money (and boosting ill-paid doctors' salaries) by prescribing ever more expensive treatment and diagnostic procedures. With the collapse and privatisation of state-owned enterprises, the vast majority of citizens had been left with no insurance. Many began avoiding even desperately needed treatment.
In 2003 the government introduced a new medical-insurance scheme in the countryside. This involves contributions from rural residents as well as local governments and, for the first time, the central government. The number of people taking part rose from 80m that year to more than 730m now. This month Wu Yi, a deputy prime minister, said all rural residents (about 800m is the usual official figure) should be insured by the end of this year.
The scheme is only a slight relief, if at all, for the poor. It often does not cover routine outpatient treatment. The average reimbursement rate is only 30-40%, and bills have to be paid in full in advance. So hospital stays are beyond the means of many. There is also a big loophole: those insured can get benefits only in their own localities. Many younger people from the countryside are working in cities where they have to pay all of their treatment costs. A new labour-contract law introduced this year requires employers to pay medical insurance for such workers. But migrants are often hired informally, making it easy for employers to evade such requirements.
Even though urban health care receives a disproportionate share of total government spending on health, many urban residents fare just as badly. Li Ling of Peking University estimates that more than half of the urban population has no insurance. Those who do are mostly civil servants and the staff of state-owned enterprises. At least until the labour-contract law was enacted, many private enterprises provided nothing. Last year the government introduced an urban insurance scheme (similar to the rural one) aimed at non-working residents, including children and university students. The aim is to have every urban citizen covered by 2010.
Much detail, however, is still unclear. A big issue is how to wean hospitals off their dependence on revenue from user payments. Policymakers and academics have been furiously debating whether the emphasis should be on government subsidies for hospitals or on reimbursements for patients. No target has yet been set for the maximum share of health expenditure to come from patients' own pockets. Ms Li, who has been advising the government on health reform, suggests a goal of 20% compared with over 50% at present.
Unlike for education, Chinese officials have also yet to set any specific targets for government spending as a percentage of GDP. The government spends a mere 0.8% of GDP on health (it was more than 1% in the 1980s). Henk Bekedam of the World Health Organisation says it could easily afford around 2.5%. But the government is being cautious. Reform, said Ms Wu last month, would be complicated. "Patience is needed," she said. Patients would say they have shown more than enough already.
Normxxx
______________
The contents of any third-party letters/reports above do not necessarily reflect the opinions or viewpoint of normxxx. They are provided for informational/educational purposes only.
The content of any message or post by normxxx anywhere on this site is not to be construed as constituting market or investment advice. Such is intended for educational purposes only. Individuals should always consult with their own advisors for specific investment advice.
From The Economist Print Edition | 25 February 2008
| An Orthodox Approach To Fixing The Unavailability Of Decent Health Care |
Startling economic growth in China has not been matched by similar improvements in health care. The cost of treatment is becoming ever more prohibitive for the poor. Government spending is meagre. But nearly three years after declaring the system a failure, officials are at last getting ready to unveil a plan to fix it.
It will cost themSome Chinese press reports say the long-awaited and much-debated reform plan is likely to be revealed at the annual session of China's parliament, which opens on March 5th. The outline is already clear: a stronger role for government, including more money from the central budget, and a drive towards universal health insurance. Changes are already in train.
The reforms reverse the market-driven policies of much of the past two decades. The outbreak in 2003 of SARS, an often fatal respiratory disease, made the government realise what a mess the health-care system had become. Government hospitals and clinics, starved of funding, had turned to raising money (and boosting ill-paid doctors' salaries) by prescribing ever more expensive treatment and diagnostic procedures. With the collapse and privatisation of state-owned enterprises, the vast majority of citizens had been left with no insurance. Many began avoiding even desperately needed treatment.
In 2003 the government introduced a new medical-insurance scheme in the countryside. This involves contributions from rural residents as well as local governments and, for the first time, the central government. The number of people taking part rose from 80m that year to more than 730m now. This month Wu Yi, a deputy prime minister, said all rural residents (about 800m is the usual official figure) should be insured by the end of this year.
The scheme is only a slight relief, if at all, for the poor. It often does not cover routine outpatient treatment. The average reimbursement rate is only 30-40%, and bills have to be paid in full in advance. So hospital stays are beyond the means of many. There is also a big loophole: those insured can get benefits only in their own localities. Many younger people from the countryside are working in cities where they have to pay all of their treatment costs. A new labour-contract law introduced this year requires employers to pay medical insurance for such workers. But migrants are often hired informally, making it easy for employers to evade such requirements.
Even though urban health care receives a disproportionate share of total government spending on health, many urban residents fare just as badly. Li Ling of Peking University estimates that more than half of the urban population has no insurance. Those who do are mostly civil servants and the staff of state-owned enterprises. At least until the labour-contract law was enacted, many private enterprises provided nothing. Last year the government introduced an urban insurance scheme (similar to the rural one) aimed at non-working residents, including children and university students. The aim is to have every urban citizen covered by 2010.
Much detail, however, is still unclear. A big issue is how to wean hospitals off their dependence on revenue from user payments. Policymakers and academics have been furiously debating whether the emphasis should be on government subsidies for hospitals or on reimbursements for patients. No target has yet been set for the maximum share of health expenditure to come from patients' own pockets. Ms Li, who has been advising the government on health reform, suggests a goal of 20% compared with over 50% at present.
Unlike for education, Chinese officials have also yet to set any specific targets for government spending as a percentage of GDP. The government spends a mere 0.8% of GDP on health (it was more than 1% in the 1980s). Henk Bekedam of the World Health Organisation says it could easily afford around 2.5%. But the government is being cautious. Reform, said Ms Wu last month, would be complicated. "Patience is needed," she said. Patients would say they have shown more than enough already.
Normxxx
______________
The contents of any third-party letters/reports above do not necessarily reflect the opinions or viewpoint of normxxx. They are provided for informational/educational purposes only.
The content of any message or post by normxxx anywhere on this site is not to be construed as constituting market or investment advice. Such is intended for educational purposes only. Individuals should always consult with their own advisors for specific investment advice.
Ja-pain
Japain
From The Economist print edition | 25 February 2008
 The ghost of Japan's "lost decade" haunts the United States. As the consequences of America's burst housing bubble are felt through financial markets, it has become popular to ask whether Japan's awful experience of boom-and-bust has lessons for other rich countries facing, at best, sharp slowdowns. Japan's property-and-stockmarket bubble burst in 1990, creating bad loans equivalent in the end to about one-fifth of GDP. The economy began growing properly again only 12 years later, and only in 2005 could Japan say it had put financial stress and debt-deflation behind it. Even today the country's nominal GDP remains below its peak in the 1990s— a brutal measure of lost opportunities.
Yet ghosts can deceive. Similarities exist between Japan then and America today, notably the way that a financial crisis threatens the "real" economy. But the differences outnumber them. Japan should indeed be a source of worry— not, however, because other rich countries are destined for the same economic plughole, but because it is the world's second-biggest economy and it has still not tackled the fundamental causes of its malaise.
A Tale Of Two Crunches
Even by today's gloomiest assumptions, Japan's bust dwarfs America's, if in part because its boom did too. Take for instance the collapse in the equity market. America's S&P 500 is down just 8% from its 1999 peak. The Nikkei 225 share index is now nearly two-thirds below its 1989 peak. In commercial property, the comparison between the two boom-and-busts is almost as dramatic.
The more important difference, though, is how each country got into its mess and then responded to it. In America, the government can be blamed for inadequate oversight of the vast market in slicing and dicing mortgages, but it has reacted aggressively to the bust, with monetary and fiscal stimulus. Financial institutions are busy declaring their losses. In Japan, the government was deeply complicit in puffing up the market and complicit, too, in hiding the ensuing mess for years.
Japan's economy is still held back by its politicians (see article). Though much has changed since 1990, a the current cyclical slowdown is now laying bare Japan's structural shortcomings. A few years ago, people hoped that Japan, which is still a bigger economic power than China and has some marvellous companies, would help take up some of the slack in the world economy if America lagged; that now looks unlikely. Productivity is disastrously low: the return on new investment is around half that in America. Consumption is still flagging, thanks in part to companies' failure to increase wages. Bureaucratic blunders have cost the economy dearly, and Japan needs a swathe of reforms to trade and competition without which the economy will continue to disappoint.
The Liberal Democratic Party (LDP), which has ruled for the best part of half a century and remains a machine of pork and patronage, has given up trying to tackle these problems. What reformist tendencies it had under the maverick Junichiro Koizumi, prime minister between 2001 and 2006, have now gone into reverse. To make matters worse, last July the opposition Democratic Party of Japan (DPJ) won control of the upper house of the Diet (parliament). The constitution never envisaged upper and lower houses of the Diet being controlled by opposing parties, and since the upper house has nearly equal powers to the lower one, the opposition can frustrate virtually every government initiative.
Thus Yasuo Fukuda, prime minister since September, spent his first four months in office fighting to reauthorise a solitary refuelling ship operating in the Indian Ocean. Now the government is locked in grinding battles with the DPJ over bills to authorise a budget for the fiscal year that starts in April and to appoint a new governor of the Bank of Japan on March 19th.
But the problem is not merely a constitutional one. Japan is at an uncomfortable point: no longer a one-party state, yet still far from being a competitive democracy with rival parties alternating in power. Both main parties are riven by contradictions: both contain modernisers alongside a grizzled old guard of conservatives and socialists. Political chaos has allowed the old forces within the LDP— the factions, the conservative bureaucrats, the builders and the farmers— to reassert their influence. Meanwhile, the DPJ's leader, Ichiro Ozawa, who used to have a reformist streak, now sounds like an old-style LDP boss.
Japan's politics is skidding for the buffers. The crash may come as early as March, over budget differences. One way to avoid it, some politicians think, is for the LDP and the DPJ to form the kind of "grand coalition" which Mr Fukuda and Mr Ozawa talked about in November. This plan was thwarted when the rest of the DPJ leadership, rightly, balked: in effect, it would have taken Japan back towards being a one-party state, distributing largesse rather than reforming the economy.
Time For A Good Wash
Yet the buffers may be the best place for Japan. Or rather, a general election— perhaps a string of elections— offers the best chance of forcing parties to confront their inconsistencies, offering voters real choices rather than candidates who compete to bring home the bacon.
There are glimmers of hope. A cross-party group of modernising politicians, academics and businessmen has formed a pressure group, Sentaku (with connotations both of choice and of giving things a good wash). Radically, they want to decentralise the top-heavy system in which local politicians are in thrall to Tokyo's pork providers; they think the main parties should campaign on coherent manifestos; and they are urging ordinary Japanese, who do not readily bother their heads about such things, to reflect on the folly of voting for politicians who smother their districts in unused highways and bridges that lead nowhere— the visible blight of failed politics.
Many politicians say a general election would only add to the chaos. That is the argument of a political class grown fat on a broken system. Voters need a chance to start putting it right. If choice is chaos, bring it on.
Japan's Pain: Why Japan Keeps Failing
From Economist Print Edition | 25 February 2008
TOKYO | Feb 21st 2008—
 Ten years ago Japan was on the point of financial and economic meltdown, with a political establishment utterly incapable of facing up to the crisis. Those Japanese who cared coined a not altogether pleasing English phrase: "Japan passing", implying not only that the world's second biggest economy was being passed by in a fast-changing world, but also that Japan could no longer even be taken seriously. A headline in The Economist at the time tried to sum up the situation more pithily: "Japan's amazing ability to disappoint" (see article).
Until recently, that dreadful time could be regarded as an awful nightmare from which the country had woken up, for Japan seemed to be starting to live up to expectations. A razzle-dazzle prime minister, Junichiro Koizumi, came to office in 2001, appearing to bring profound change both to the political establishment and to its ability to deal with economic problems which had festered since Japan's asset bubble burst in 1990.
Mr Koizumi forced banks and companies to clear up piles of bad loans. Companies, thus unburdened, started to make money once more, and from early 2002 the economy began to grow again. Mr Koizumi appeared to have weakened the special interests— farmers, the construction ministry, senior bureaucrats— to which his ruling Liberal Democratic Party (LDP) had long been in thrall and which had supported its near-unbroken rule over the past half-century. In effect, Mr Koizumi declared war on the old-style LDP.
Voters loved it. Under Mr Koizumi's banner of market-minded reform, they delivered a stunning general-election victory to the LDP and its coalition partner, New Komeito, in September 2005. When Mr Koizumi retired a year later, there was a widespread belief that Japan was set fair for economic modernisation.
 Yet once more there is talk of "Japan passing". The stockmarket has fallen alarmingly since last summer, and has been in open rout for much of 2008 (see chart at left). Measured by the Nikkei 225 share index, Japanese shares are 27% below last year's July high: deep bear-market territory. Share prices are now back to their levels of September 2005— not even half where they stood 20 years ago. In January foreign investors pulled record amounts out of the Japanese stockmarket. Ask any money manager: Japan still has an amazing ability to disappoint.
The latest doubts concern the robustness of Japan's four-year recovery, during which the economy has grown at a remarkably steady 2% or so a year. Though the most recent GDP estimate, for the last quarter of 2007, suggests above-average growth, many economists point out that the series is notoriously volatile, business investment has probably been exaggerated, and the quarterly growth figure will therefore very likely be revised downwards. Economists at Goldman Sachs said in late January that the economy was already in recession; others who are not so sure claim it is a close-run thing.
Meanwhile, political chaos has reigned since last summer. It has unseated one prime minister, Shinzo Abe, who succeeded Mr Koizumi but resigned under nervous and physical strain in September 2007. And it has ensured only the vaguest grip on power for his successor, Yasuo Fukuda. The chaos was set in train when the opposition Democratic Party of Japan (DPJ), led by Ichiro Ozawa, became the dominant party in the upper house of the Diet (parliament) last July after elections for half the chamber's seats. It has now brought the impetus for growth-boosting reforms, or indeed for any joined-up policymaking at all, to a halt.
So now the LDP's Diet-affairs chairman, Tadamori Oshima, responsible for pushing through Mr Fukuda's agenda, such as it is, despairs that "investors and political establishments around the world take one look at Japan today and conclude that we politicians are incapable of deciding on anything, not even whether to put one foot in front of the other." With foreign investors selling out, says Mr Oshima, Japan is fast becoming as irrelevant as it was a decade ago. He asks this British correspondent to prescribe a decent shinguru moruto— single malt— for his depression.
Despair is spreading among the political class responsible for the mess. If the opposition deplored the "absence of a framework to sustain economic growth", you might take it with a pinch of salt. But the admission comes from none other than the economy minister, Hiroko Ota, who for good measure says that Japan can no longer be considered a "top-tier" economy. Although she identifies the problem correctly, she has disappointingly little to say about how to solve it.
Demographics darken Japan's prospects further. Its population is greying faster than that of any other big economy, so the old will become an increasing burden on workers. Today, one-fifth of Japanese are over 65; by 2015 the proportion will grow to one in four, or about 30m. Now, with Japan's birth rate well below replacement, at 1.32, and with little immigration to speak of, the population of 127m has already started to shrink and will fall each year by about 0.6% over the next half-century. It is predicted to drop below 100m by mid-century. Already, rural regions are emptying, and the shutters are closing on the centres of more and more small towns. Without robust economic growth, Japan faces pain, especially since the government has racked up high levels of national debt in an attempt to spend its way out of its post-bubble slump.
The Bureaucrats' Blunders
Even though companies are far sounder than they were a decade ago, with fewer debts and more focused operations, Japan's productivity is still pitifully low. A lack of investment is not the problem. Rather, low interest rates, an export boom and a business environment in which managers are scarcely accountable to shareholders may have generated too much of the stuff. Indeed, as Andrew Smithers of Smithers & Co points out, high investment and slow growth mean that Japan's return on new investment is around half the level in America. At least companies, notably Japan's exporters, have been making record profits. But now the impact on exports of higher oil prices, coupled with a sharp rise in the yen since last summer— a consequence largely of financial-market volatility— throws that profitability into question. That is even before considering what harm an American-led slowdown might do.
Were Japan's recovery broad-based, an export slowdown would matter less, because domestic consumption would take up the slack. Yet despite repeated predictions from economists, household spending has failed to follow a rise in business investment and exports.
The reason again lies with companies. Even where they have been making record profits, companies have hoarded their cash rather than pay more out in the form of higher wages, which have stagnated even as employment has increased. Now that a stronger yen and dearer oil are eating into profit margins, the situation may not improve soon. As a result, Mr Smithers notes, even after drawing down savings this decade, households still consume a smaller proportion of GDP than in any other rich country. It raises a question: was the path that Mr Koizumi chose to get Japan out of the economic swamp misguided, at least in part? By emphasising low interest rates (good for indebted companies but bad for savers) and low wages (ditto) to help companies out of their mess, Japan's economy has depended too much on exports and is now worryingly vulnerable to external shocks.
Politicians complain about firms' tendency to hoard cash, and urge firms to pay workers more. Yet the incompetence and unpredictability of politicians help explain the companies' caution. A year ago, for instance, in a well-intentioned attempt to crack down on predatory lending, the government all but destroyed the consumer-finance industry.
A more serious episode still started last summer, when a system for vetting new buildings was introduced in reaction to the endemic faking of earthquake-proofing data— itself a reaction to hasty new regulation brought in a few years back. The housing ministry was unable to get new software for the new system running in time. New-building approvals ground to a halt, and new construction fell by 40%.
Slowly, matters are righting themselves— new construction in December was just one-fifth below levels a year earlier. But the extraordinary effect of a single bureaucratic bungle has been to knock 0.6 percentage points off Japan's growth. The building-standards fiasco was one reason for the reduction in the government's growth forecast for the fiscal year to the end of March, from 2.1% to 1.3%.
These costly blunders were committed even before July's elections divided the Diet; with the current political chaos, the risks of things going wrong is still higher. The incompetence of politicians and bureaucrats does not just lead to expensive short-term disasters; it also threatens Japan's long-term growth prospects.
Japan needs a mass of economic reforms— a more open climate to foreign investment, for instance, lower tariffs on imported food, fewer subsidies for farmers, freer trade, better tax treatment of foreign companies, the abolition of a welter of business subsidies, a more flexible labour market, greater fiscal rectitude (national debt is currently around 180% of GDP), more accountability by pension funds and insurance companies, further privatisation of services and much more. Takatoshi Ito of Tokyo University, who sits on the Council on Economic and Fiscal Policy, the government's advisory body that drove structural reform during the Koizumi years, has calculated the economic benefit of pursuing the reforms the CEFP advocates, and the costs of abandoning them. Pursue reform, he argues, and Japan should be able to grow at a respectable 2% a year. Abandon it, and growth will crawl along at 1-1.4%.
And crawl it will, if Mr Ito is right, because Japan has abandoned reform. Blame a political establishment of underwhelming talent and vision, and an almighty constitutional mess.
 The guilty men: Abe, Fukuda, Ozawa
First in line for blame is Mr Abe. Though he came to office as a self-styled reformer, nothing he has ever said or done suggests an interest in improving the economy. Once in office, he seems to have calculated that Japan would chug happily along, leaving him to pursue pet nationalist themes such as inculcating patriotism in schools. A tin ear for other issues left him oblivious to a growing chorus of dismay at decaying country towns, sluggish wage growth and a growing scandal of bureaucratic incompetence and corruption in the state pension system. On top of that, Mr Abe's government, though short-lived, was dogged by a seemingly endless series of financial scandals. The LDP's upper-house defeat was the punishment. Amazingly, Mr Abe appears to think he deserves another shot at high office— at 53, he is young by the standards of Japanese politicians.
Second in line are the ancient crocodiles of the LDP. In a panic, they closed around Mr Fukuda, who at 71 is the face of experience over Mr Abe's callow youth. Under Mr Koizumi and Mr Abe, decision-making had devolved from the LDP corridors to the prime minister and even as far down as the cabinet. Under Mr Fukuda, power has flowed back to the factions and to the party gerontocrats— notably two former prime ministers, Yasuhiro Nakasone (89) and Yoshiro Mori (70) as well as Tsuneo Watanabe (81), publisher of Japan's biggest-circulation newspaper, the Yomiuri Shimbun. It was Mr Watanabe who arranged the farcical secret meetings late last year between Mr Ozawa, leader of the opposition DPJ, and Mr Fukuda about forming a "grand coalition"— though he has not since bothered to inform his newspaper's readers about that.
Taking Back The Car Keys
In effect, a generational coup has taken place, with the keys to the political car taken back by the oldies. The result is that structural change is on hold. Negotiations to lower trade barriers with other countries have slowed. Tax reform to set the budget on an even keel has been put off. A senior reform-minded civil servant says that morale among modernising bureaucrats, those that favour privatisation and more competition, has sunk. None of them, he says, now dares propose growth-boosting reforms— as they used to under Mr Koizumi and even Mr Abe— for fear of incurring the disfavour of their political masters. Meanwhile, attacks on foreign investment are on the rise again among politicians and old-guard civil servants.
Mr Fukuda understands Japan's problems better than Mr Abe did. He spelt some of them out in his policy address to the Diet's new session last month: he underlined the need to overcome labour-market rigidities that discourage women and the elderly, and discriminate against Japan's army of workers who can find only temporary jobs. He bemoaned Japan's feeble standing as an international financial centre, thanks in part to hostility to foreign investment. He stressed the importance of putting the government's rickety finances to rights, and he has since championed the cause of consumers.
Yet both allies and opponents alike believe he has neither the gumption nor the authority forcefully to push for these goals. In particular, the government already looks like missing a long-agreed target to balance the budget, before interest payments, by 2011. In the government's latest budget, for the fiscal year beginning in April, the LDP's traditional clients, farmers and road-builders, are getting goodies denied them in recent years.
Third in line for blame comes the DPJ's Mr Ozawa. His party's ranks have plenty of young politicians favouring market-driven reforms. Deploring the one-party state that Japan has largely been under the LDP since the second world war, this bunch thinks Japan would be better served by competitive parties alternating in power. Perhaps Mr Ozawa does, too. After all, nearly two decades ago when he himself was a baron in the LDP, he first launched the debate about how Japan should modernise long before the political establishment was thinking about it. Ever since he stormed out of the LDP, he has vowed to bring it down.
Mr Ozawa's style, however, if occasionally brilliant, is also thin-skinned and autocratic: he does his deals in the shadows without consulting colleagues. These are hardly the right qualities for the leader of a party that makes such a great show of transparency and accountability.
Meanwhile, his mercurial character has only gotten more erratic. Since campaigning as the farmer's friend— admittedly a successful strategy in the upper-house elections, where rural votes carried a disproportionate weight— Mr Ozawa has come to sound like the old-style LDP bosses against whom he once turned. That unsettles the modernisers in his party, most of whom represent urban, more reform-minded constituencies.
And how else, apart from ascribing a growing erratic streak to Mr Ozawa, to explain the extraordinary about-face last November, when he switched from vowing to bring down Mr Fukuda and his government to cutting private deals with the prime minister? To the DPJ's modernisers, a grand coalition would spell doom to the party, which defines itself precisely by offering itself as an alternative to the LDP. Younger parliamentarians have become so dissatisfied with Mr Ozawa that Yukio Hatoyama, the DPJ's secretary-general, now says that he, and not Mr Ozawa, is answerable to the party caucus. It is a hint that Mr Ozawa, at least for the time being, has agreed to cede some authority.
Yet Mr Ozawa has a gun to the party's head. He knows that a split over his leadership might cause the DPJ to crumble. And should he choose to leave (he has flounced out of parties before), a handful of parliamentarians leaving with him would mean that the DPJ would almost certainly lose its upper-house majority.
Most of all, perhaps, blame two parties bursting with internal contradictions, a constitution that never envisaged opposing parties controlling the Diet's two chambers, and a culture that treats politics as a personal, sometimes family, business, not a means of offering voters choices about how their country should be run. An election would not solve these problems, but it might at least encourage parties to tell voters what they stand for.
Lastly, the voters must take some of the blame. Ten years ago, when The Economist lamented Japan's amazing ability to disappoint, one shrewd parliamentarian wrote in to challenge that. The headline, he said, should have read: "The Japanese people's amazing inability to be disappointed". A general election would at least give them the chance to start holding their politicians to a higher standard.
ߧ
Normxxx
______________
The contents of any third-party letters/reports above do not necessarily reflect the opinions or viewpoint of normxxx. They are provided for informational/educational purposes only.
The content of any message or post by normxxx anywhere on this site is not to be construed as constituting market or investment advice. Such is intended for educational purposes only. Individuals should always consult with their own advisors for specific investment advice.
From The Economist print edition | 25 February 2008
| The World's Second-Biggest Economy Is Still In A Funk— And Politics Is The Problem |
The ghost of Japan's "lost decade" haunts the United States. As the consequences of America's burst housing bubble are felt through financial markets, it has become popular to ask whether Japan's awful experience of boom-and-bust has lessons for other rich countries facing, at best, sharp slowdowns. Japan's property-and-stockmarket bubble burst in 1990, creating bad loans equivalent in the end to about one-fifth of GDP. The economy began growing properly again only 12 years later, and only in 2005 could Japan say it had put financial stress and debt-deflation behind it. Even today the country's nominal GDP remains below its peak in the 1990s— a brutal measure of lost opportunities.Yet ghosts can deceive. Similarities exist between Japan then and America today, notably the way that a financial crisis threatens the "real" economy. But the differences outnumber them. Japan should indeed be a source of worry— not, however, because other rich countries are destined for the same economic plughole, but because it is the world's second-biggest economy and it has still not tackled the fundamental causes of its malaise.
A Tale Of Two Crunches
Even by today's gloomiest assumptions, Japan's bust dwarfs America's, if in part because its boom did too. Take for instance the collapse in the equity market. America's S&P 500 is down just 8% from its 1999 peak. The Nikkei 225 share index is now nearly two-thirds below its 1989 peak. In commercial property, the comparison between the two boom-and-busts is almost as dramatic.
The more important difference, though, is how each country got into its mess and then responded to it. In America, the government can be blamed for inadequate oversight of the vast market in slicing and dicing mortgages, but it has reacted aggressively to the bust, with monetary and fiscal stimulus. Financial institutions are busy declaring their losses. In Japan, the government was deeply complicit in puffing up the market and complicit, too, in hiding the ensuing mess for years.
Japan's economy is still held back by its politicians (see article). Though much has changed since 1990, a the current cyclical slowdown is now laying bare Japan's structural shortcomings. A few years ago, people hoped that Japan, which is still a bigger economic power than China and has some marvellous companies, would help take up some of the slack in the world economy if America lagged; that now looks unlikely. Productivity is disastrously low: the return on new investment is around half that in America. Consumption is still flagging, thanks in part to companies' failure to increase wages. Bureaucratic blunders have cost the economy dearly, and Japan needs a swathe of reforms to trade and competition without which the economy will continue to disappoint.
The Liberal Democratic Party (LDP), which has ruled for the best part of half a century and remains a machine of pork and patronage, has given up trying to tackle these problems. What reformist tendencies it had under the maverick Junichiro Koizumi, prime minister between 2001 and 2006, have now gone into reverse. To make matters worse, last July the opposition Democratic Party of Japan (DPJ) won control of the upper house of the Diet (parliament). The constitution never envisaged upper and lower houses of the Diet being controlled by opposing parties, and since the upper house has nearly equal powers to the lower one, the opposition can frustrate virtually every government initiative.
Thus Yasuo Fukuda, prime minister since September, spent his first four months in office fighting to reauthorise a solitary refuelling ship operating in the Indian Ocean. Now the government is locked in grinding battles with the DPJ over bills to authorise a budget for the fiscal year that starts in April and to appoint a new governor of the Bank of Japan on March 19th.
But the problem is not merely a constitutional one. Japan is at an uncomfortable point: no longer a one-party state, yet still far from being a competitive democracy with rival parties alternating in power. Both main parties are riven by contradictions: both contain modernisers alongside a grizzled old guard of conservatives and socialists. Political chaos has allowed the old forces within the LDP— the factions, the conservative bureaucrats, the builders and the farmers— to reassert their influence. Meanwhile, the DPJ's leader, Ichiro Ozawa, who used to have a reformist streak, now sounds like an old-style LDP boss.
Japan's politics is skidding for the buffers. The crash may come as early as March, over budget differences. One way to avoid it, some politicians think, is for the LDP and the DPJ to form the kind of "grand coalition" which Mr Fukuda and Mr Ozawa talked about in November. This plan was thwarted when the rest of the DPJ leadership, rightly, balked: in effect, it would have taken Japan back towards being a one-party state, distributing largesse rather than reforming the economy.
Time For A Good Wash
Yet the buffers may be the best place for Japan. Or rather, a general election— perhaps a string of elections— offers the best chance of forcing parties to confront their inconsistencies, offering voters real choices rather than candidates who compete to bring home the bacon.
There are glimmers of hope. A cross-party group of modernising politicians, academics and businessmen has formed a pressure group, Sentaku (with connotations both of choice and of giving things a good wash). Radically, they want to decentralise the top-heavy system in which local politicians are in thrall to Tokyo's pork providers; they think the main parties should campaign on coherent manifestos; and they are urging ordinary Japanese, who do not readily bother their heads about such things, to reflect on the folly of voting for politicians who smother their districts in unused highways and bridges that lead nowhere— the visible blight of failed politics.
Many politicians say a general election would only add to the chaos. That is the argument of a political class grown fat on a broken system. Voters need a chance to start putting it right. If choice is chaos, bring it on.
Japan's Pain: Why Japan Keeps Failing
From Economist Print Edition | 25 February 2008
TOKYO | Feb 21st 2008—
| How The Politicians Are To Blame For The Failure Of Japan's Recovery |
Ten years ago Japan was on the point of financial and economic meltdown, with a political establishment utterly incapable of facing up to the crisis. Those Japanese who cared coined a not altogether pleasing English phrase: "Japan passing", implying not only that the world's second biggest economy was being passed by in a fast-changing world, but also that Japan could no longer even be taken seriously. A headline in The Economist at the time tried to sum up the situation more pithily: "Japan's amazing ability to disappoint" (see article).Until recently, that dreadful time could be regarded as an awful nightmare from which the country had woken up, for Japan seemed to be starting to live up to expectations. A razzle-dazzle prime minister, Junichiro Koizumi, came to office in 2001, appearing to bring profound change both to the political establishment and to its ability to deal with economic problems which had festered since Japan's asset bubble burst in 1990.
Mr Koizumi forced banks and companies to clear up piles of bad loans. Companies, thus unburdened, started to make money once more, and from early 2002 the economy began to grow again. Mr Koizumi appeared to have weakened the special interests— farmers, the construction ministry, senior bureaucrats— to which his ruling Liberal Democratic Party (LDP) had long been in thrall and which had supported its near-unbroken rule over the past half-century. In effect, Mr Koizumi declared war on the old-style LDP.
Voters loved it. Under Mr Koizumi's banner of market-minded reform, they delivered a stunning general-election victory to the LDP and its coalition partner, New Komeito, in September 2005. When Mr Koizumi retired a year later, there was a widespread belief that Japan was set fair for economic modernisation.
Yet once more there is talk of "Japan passing". The stockmarket has fallen alarmingly since last summer, and has been in open rout for much of 2008 (see chart at left). Measured by the Nikkei 225 share index, Japanese shares are 27% below last year's July high: deep bear-market territory. Share prices are now back to their levels of September 2005— not even half where they stood 20 years ago. In January foreign investors pulled record amounts out of the Japanese stockmarket. Ask any money manager: Japan still has an amazing ability to disappoint.The latest doubts concern the robustness of Japan's four-year recovery, during which the economy has grown at a remarkably steady 2% or so a year. Though the most recent GDP estimate, for the last quarter of 2007, suggests above-average growth, many economists point out that the series is notoriously volatile, business investment has probably been exaggerated, and the quarterly growth figure will therefore very likely be revised downwards. Economists at Goldman Sachs said in late January that the economy was already in recession; others who are not so sure claim it is a close-run thing.
Meanwhile, political chaos has reigned since last summer. It has unseated one prime minister, Shinzo Abe, who succeeded Mr Koizumi but resigned under nervous and physical strain in September 2007. And it has ensured only the vaguest grip on power for his successor, Yasuo Fukuda. The chaos was set in train when the opposition Democratic Party of Japan (DPJ), led by Ichiro Ozawa, became the dominant party in the upper house of the Diet (parliament) last July after elections for half the chamber's seats. It has now brought the impetus for growth-boosting reforms, or indeed for any joined-up policymaking at all, to a halt.
So now the LDP's Diet-affairs chairman, Tadamori Oshima, responsible for pushing through Mr Fukuda's agenda, such as it is, despairs that "investors and political establishments around the world take one look at Japan today and conclude that we politicians are incapable of deciding on anything, not even whether to put one foot in front of the other." With foreign investors selling out, says Mr Oshima, Japan is fast becoming as irrelevant as it was a decade ago. He asks this British correspondent to prescribe a decent shinguru moruto— single malt— for his depression.
Despair is spreading among the political class responsible for the mess. If the opposition deplored the "absence of a framework to sustain economic growth", you might take it with a pinch of salt. But the admission comes from none other than the economy minister, Hiroko Ota, who for good measure says that Japan can no longer be considered a "top-tier" economy. Although she identifies the problem correctly, she has disappointingly little to say about how to solve it.
Demographics darken Japan's prospects further. Its population is greying faster than that of any other big economy, so the old will become an increasing burden on workers. Today, one-fifth of Japanese are over 65; by 2015 the proportion will grow to one in four, or about 30m. Now, with Japan's birth rate well below replacement, at 1.32, and with little immigration to speak of, the population of 127m has already started to shrink and will fall each year by about 0.6% over the next half-century. It is predicted to drop below 100m by mid-century. Already, rural regions are emptying, and the shutters are closing on the centres of more and more small towns. Without robust economic growth, Japan faces pain, especially since the government has racked up high levels of national debt in an attempt to spend its way out of its post-bubble slump.
The Bureaucrats' Blunders
Even though companies are far sounder than they were a decade ago, with fewer debts and more focused operations, Japan's productivity is still pitifully low. A lack of investment is not the problem. Rather, low interest rates, an export boom and a business environment in which managers are scarcely accountable to shareholders may have generated too much of the stuff. Indeed, as Andrew Smithers of Smithers & Co points out, high investment and slow growth mean that Japan's return on new investment is around half the level in America. At least companies, notably Japan's exporters, have been making record profits. But now the impact on exports of higher oil prices, coupled with a sharp rise in the yen since last summer— a consequence largely of financial-market volatility— throws that profitability into question. That is even before considering what harm an American-led slowdown might do.
Were Japan's recovery broad-based, an export slowdown would matter less, because domestic consumption would take up the slack. Yet despite repeated predictions from economists, household spending has failed to follow a rise in business investment and exports.
The reason again lies with companies. Even where they have been making record profits, companies have hoarded their cash rather than pay more out in the form of higher wages, which have stagnated even as employment has increased. Now that a stronger yen and dearer oil are eating into profit margins, the situation may not improve soon. As a result, Mr Smithers notes, even after drawing down savings this decade, households still consume a smaller proportion of GDP than in any other rich country. It raises a question: was the path that Mr Koizumi chose to get Japan out of the economic swamp misguided, at least in part? By emphasising low interest rates (good for indebted companies but bad for savers) and low wages (ditto) to help companies out of their mess, Japan's economy has depended too much on exports and is now worryingly vulnerable to external shocks.
Politicians complain about firms' tendency to hoard cash, and urge firms to pay workers more. Yet the incompetence and unpredictability of politicians help explain the companies' caution. A year ago, for instance, in a well-intentioned attempt to crack down on predatory lending, the government all but destroyed the consumer-finance industry.
A more serious episode still started last summer, when a system for vetting new buildings was introduced in reaction to the endemic faking of earthquake-proofing data— itself a reaction to hasty new regulation brought in a few years back. The housing ministry was unable to get new software for the new system running in time. New-building approvals ground to a halt, and new construction fell by 40%.
Slowly, matters are righting themselves— new construction in December was just one-fifth below levels a year earlier. But the extraordinary effect of a single bureaucratic bungle has been to knock 0.6 percentage points off Japan's growth. The building-standards fiasco was one reason for the reduction in the government's growth forecast for the fiscal year to the end of March, from 2.1% to 1.3%.
These costly blunders were committed even before July's elections divided the Diet; with the current political chaos, the risks of things going wrong is still higher. The incompetence of politicians and bureaucrats does not just lead to expensive short-term disasters; it also threatens Japan's long-term growth prospects.
Japan needs a mass of economic reforms— a more open climate to foreign investment, for instance, lower tariffs on imported food, fewer subsidies for farmers, freer trade, better tax treatment of foreign companies, the abolition of a welter of business subsidies, a more flexible labour market, greater fiscal rectitude (national debt is currently around 180% of GDP), more accountability by pension funds and insurance companies, further privatisation of services and much more. Takatoshi Ito of Tokyo University, who sits on the Council on Economic and Fiscal Policy, the government's advisory body that drove structural reform during the Koizumi years, has calculated the economic benefit of pursuing the reforms the CEFP advocates, and the costs of abandoning them. Pursue reform, he argues, and Japan should be able to grow at a respectable 2% a year. Abandon it, and growth will crawl along at 1-1.4%.
And crawl it will, if Mr Ito is right, because Japan has abandoned reform. Blame a political establishment of underwhelming talent and vision, and an almighty constitutional mess.
The guilty men: Abe, Fukuda, OzawaFirst in line for blame is Mr Abe. Though he came to office as a self-styled reformer, nothing he has ever said or done suggests an interest in improving the economy. Once in office, he seems to have calculated that Japan would chug happily along, leaving him to pursue pet nationalist themes such as inculcating patriotism in schools. A tin ear for other issues left him oblivious to a growing chorus of dismay at decaying country towns, sluggish wage growth and a growing scandal of bureaucratic incompetence and corruption in the state pension system. On top of that, Mr Abe's government, though short-lived, was dogged by a seemingly endless series of financial scandals. The LDP's upper-house defeat was the punishment. Amazingly, Mr Abe appears to think he deserves another shot at high office— at 53, he is young by the standards of Japanese politicians.
Second in line are the ancient crocodiles of the LDP. In a panic, they closed around Mr Fukuda, who at 71 is the face of experience over Mr Abe's callow youth. Under Mr Koizumi and Mr Abe, decision-making had devolved from the LDP corridors to the prime minister and even as far down as the cabinet. Under Mr Fukuda, power has flowed back to the factions and to the party gerontocrats— notably two former prime ministers, Yasuhiro Nakasone (89) and Yoshiro Mori (70) as well as Tsuneo Watanabe (81), publisher of Japan's biggest-circulation newspaper, the Yomiuri Shimbun. It was Mr Watanabe who arranged the farcical secret meetings late last year between Mr Ozawa, leader of the opposition DPJ, and Mr Fukuda about forming a "grand coalition"— though he has not since bothered to inform his newspaper's readers about that.
Taking Back The Car Keys
In effect, a generational coup has taken place, with the keys to the political car taken back by the oldies. The result is that structural change is on hold. Negotiations to lower trade barriers with other countries have slowed. Tax reform to set the budget on an even keel has been put off. A senior reform-minded civil servant says that morale among modernising bureaucrats, those that favour privatisation and more competition, has sunk. None of them, he says, now dares propose growth-boosting reforms— as they used to under Mr Koizumi and even Mr Abe— for fear of incurring the disfavour of their political masters. Meanwhile, attacks on foreign investment are on the rise again among politicians and old-guard civil servants.
Mr Fukuda understands Japan's problems better than Mr Abe did. He spelt some of them out in his policy address to the Diet's new session last month: he underlined the need to overcome labour-market rigidities that discourage women and the elderly, and discriminate against Japan's army of workers who can find only temporary jobs. He bemoaned Japan's feeble standing as an international financial centre, thanks in part to hostility to foreign investment. He stressed the importance of putting the government's rickety finances to rights, and he has since championed the cause of consumers.
Yet both allies and opponents alike believe he has neither the gumption nor the authority forcefully to push for these goals. In particular, the government already looks like missing a long-agreed target to balance the budget, before interest payments, by 2011. In the government's latest budget, for the fiscal year beginning in April, the LDP's traditional clients, farmers and road-builders, are getting goodies denied them in recent years.
Third in line for blame comes the DPJ's Mr Ozawa. His party's ranks have plenty of young politicians favouring market-driven reforms. Deploring the one-party state that Japan has largely been under the LDP since the second world war, this bunch thinks Japan would be better served by competitive parties alternating in power. Perhaps Mr Ozawa does, too. After all, nearly two decades ago when he himself was a baron in the LDP, he first launched the debate about how Japan should modernise long before the political establishment was thinking about it. Ever since he stormed out of the LDP, he has vowed to bring it down.
Mr Ozawa's style, however, if occasionally brilliant, is also thin-skinned and autocratic: he does his deals in the shadows without consulting colleagues. These are hardly the right qualities for the leader of a party that makes such a great show of transparency and accountability.
Meanwhile, his mercurial character has only gotten more erratic. Since campaigning as the farmer's friend— admittedly a successful strategy in the upper-house elections, where rural votes carried a disproportionate weight— Mr Ozawa has come to sound like the old-style LDP bosses against whom he once turned. That unsettles the modernisers in his party, most of whom represent urban, more reform-minded constituencies.
And how else, apart from ascribing a growing erratic streak to Mr Ozawa, to explain the extraordinary about-face last November, when he switched from vowing to bring down Mr Fukuda and his government to cutting private deals with the prime minister? To the DPJ's modernisers, a grand coalition would spell doom to the party, which defines itself precisely by offering itself as an alternative to the LDP. Younger parliamentarians have become so dissatisfied with Mr Ozawa that Yukio Hatoyama, the DPJ's secretary-general, now says that he, and not Mr Ozawa, is answerable to the party caucus. It is a hint that Mr Ozawa, at least for the time being, has agreed to cede some authority.
Yet Mr Ozawa has a gun to the party's head. He knows that a split over his leadership might cause the DPJ to crumble. And should he choose to leave (he has flounced out of parties before), a handful of parliamentarians leaving with him would mean that the DPJ would almost certainly lose its upper-house majority.
Most of all, perhaps, blame two parties bursting with internal contradictions, a constitution that never envisaged opposing parties controlling the Diet's two chambers, and a culture that treats politics as a personal, sometimes family, business, not a means of offering voters choices about how their country should be run. An election would not solve these problems, but it might at least encourage parties to tell voters what they stand for.
Lastly, the voters must take some of the blame. Ten years ago, when The Economist lamented Japan's amazing ability to disappoint, one shrewd parliamentarian wrote in to challenge that. The headline, he said, should have read: "The Japanese people's amazing inability to be disappointed". A general election would at least give them the chance to start holding their politicians to a higher standard.
ߧ
Normxxx
______________
The contents of any third-party letters/reports above do not necessarily reflect the opinions or viewpoint of normxxx. They are provided for informational/educational purposes only.
The content of any message or post by normxxx anywhere on this site is not to be construed as constituting market or investment advice. Such is intended for educational purposes only. Individuals should always consult with their own advisors for specific investment advice.
Subscribe to:
Posts (Atom)