Saturday, July 31, 2010

The Tale Of Two Economies

¹²The Tale Of Two Economies

By Contraryinvestor.Com | 1 August 2010

The tale of two economies… It simply continues, and as we see it is THE key tension in investment decision making of the moment. It's the tension of the 'macro' versus the 'micro'. After all, isn't this very tension exactly what has been playing out as 2Q earnings season has unfolded? Again, the key question being, what will be more important to investor decision making ahead, the domestic and global economic and credit cycle backdrop or company specific earnings and forward guidance?

We'll move through this little look at life as we know it at the moment relatively quickly as basically it only continues to validate the "tale of two economies" theme we have been discussing for well more than a year now. But we do believe there are some very valid conclusions that can be drawn from one of the most noticeable economic divergences we have seen in many a cycle. To the point, in recent weeks we have been treated to the quarterly Conference Board CEO business confidence survey as well as the NFIB (small business) survey for July (data through June).

As with so many business conditions surveys, the CEO confidence survey is a diffusion index. Any reading above 50 tells us the preponderance of responses were positive, and vice versa. Quarter over quarter the CEO survey was unchanged in the recent report and remains consistent with headline economic expansion based on historical precedent.

At least over the recent past, survey levels at 50 or above have been consistent with at least 3% year over year real growth in GDP. Over 70% of the CEO's surveyed expect profit growth over the next twelve months and half of the respondents expect an increase in demand to drive profitability. Alternatively, for the small business crowd, demand and poor sales is their number one concern. In terms of the US corporate sector, large and small business conditions have been and continue to remain worlds apart.

The chart below is a look at the history of the CEO survey and the bottom clip aligns the historical CEO responses with the rhythm of year over year change in nominal GDP. In terms of the confidence survey versus GDP relationship, the CEO survey has been a very important historical leading indicator valid at both cycle peaks and troughs. It's why we always check in.


The Conference Board CEO survey now joins both the recent Duke CFO and Business CEO Roundtable surveys in one unanimous and very much unambiguous message— no double dip recession ahead. In fact as per the harmonious singular message of all three, we're not even close. But, after a good bit of improvement in April and May, small business optimism again retreated in June. We've been over this before and the divergent relationship between large and small business outlooks remains completely intact in the current cycle.

Therein lies the key tension for the US economy of the moment as we see it. And the key tension for investors. Why? First, as is exemplified in the chart below, there has been a very strong historical directional relationship between small business optimism and the year over year rate of change in headline US employment.

Levels above 95 on the small business survey have been consistent with payroll expansion in the past. Yes, there has been recovery in the year over year rate of change in payroll employment, but the census worker hiring has skewed this near term and we continue to compare to meaningful prior year weakness. Stripped of census worker hiring YTD, improvement in headline US payrolls relative to the job loss numbers since 2007 is nothing short of a rounding error.


When NFIB optimism dropped below 95 in November of 2007, not only was it heralding the onset of a nasty official US recession, it also (in the clarity of hindsight) marked the end of the prior cycle month over month expansion in US payrolls. That expansion did indeed end one month later in December of 2007 as the final month for positive payroll additions. Over the subsequent 24 months ended December of 2009 the US lost 8.4 million jobs and experienced only one month of job expansion (minor) over that 24 month period.

The bottom line here is that small businesses are the largest US job creators. As long as small business conditions remain depressed, it's going to be very tough to achieve any type of sustainable domestic labor market recovery. That should be more than clear by now. CFO and CEO optimism and outlook surveys recovered meaningfully close to one year ago now, and we have little to nothing to show for it in terms of non-census related labor market expansion.

Importantly, when we look at macro economic data such as the ECRI weekly leading index, necessarily small business outcomes are being reflected in those numbers. Based solely on historical numbers precedent, the ECRI data is telling us another recession either has arrived or soon will based on the historical track record of this data series. The NFIB business optimism numbers themselves are also consistent with a recession outcome.

In fact, the NFIB numbers really tell us small businesses never exited the recession in the first place. It's clear to us that large company CFO and CEO surveys are being influenced by the ability of large companies to participate in global stimulus (lowered costs of borrowing, strength in exports as per foreign stimulus related global demand maintaining strength, etc.). But what about small businesses? What stimulus have they received?

In the past we have questioned the lack of hiring tax credits or investment tax credits conspicuously absent in Administration policy. The Fed printing up money and buying back mortgage and CRE backed paper, as well as US Treasuries has only benefited Wall Street and the banks. It has done nothing for small businesses.

The only stimulus, if you will, that might have benefited small business was the reduction in macro interest rates vis-a-vis the Fed Funds rate. But something, at least for now, has changed in the current cycle pretty dramatically relative to historical experience. As we see it, small business conditions are not responding to interest rate stimulus [[probably because 'trickle down' isn't working— what good are 'abnormally low' interest rates, if small businesses and consumers never get to see them?: normxxx]]. This is different. The chart below chronicles the relationship between the NFIB numbers and the Fed Funds rate over time.


It is clearly seen that in prior cycles, dramatic drops in the Fed Funds rate ultimately sparked a move in the NFIB optimism reading back above 95 that would indicate expansion. In fact these death defying plunges in the Funds rate meant trips below 95 on the small business survey were very short lived, as is clearly seen in the early 1990's and early 2000's recession periods. Lastly, it took ever deeper Funds rate declines to work the reflation/expansion magic in each successive recessionary cycle of sparking renewed optimism stretching over the last quarter century.

In the current cycle, despite the Fed Funds rate being somewhere near academic zero, as it has been now since December of 2008, small business optimism remains in historical recession territory. But has the historical linkage between interest rates (monetary expansion) and small business economic conditions been broken in the current cycle, as the chart suggests? We suggest that for now the answer is yes. And this is a key difference between prior cycles and the present.

As a quick aside, it is becoming very clear to us that fiscal policy may be a 'non-starter' ahead. Although there is more 2009 stimulus spending in the pipeline as we move into 2011, the political backlash against further deficit spending/stimulus continues to grow. It's not just the Tea Party. This backlash is evident in recent State primary elections and we can only imagine how it will manifest in November.

So, stepping back for a minute as we look forward, this puts increasing pressure on the Fed as potentially the sole source of further stimulus. But with interest rates already at zero, just what can the Fed now do to positively influence small business outcomes? Print more money and buy back more financial paper? Hardly, that won't do a thing to help small business.

And that says something about the whole 'pushing on a string' thesis. The cost of credit may have gotten a whole lot more attractive for large corporations, but how about for households that are the largest small business customer base? Thanks to the government for allowing the financial industry to front run changes to credit card/consumer credit regulation, cost of credit to the average household has only gone up over the recent past. Is this why the linkage above appears broken? We think it goes a long way toward explaining the current period divergence up to this point.

What has changed in the current cycle that we believe directly affects small business conditions is the lack of job growth mentioned above plus the lack of personal income growth stripped of transfer payments, as we have also discussed in depth as of late. Again, over time, the NFIB optimism survey and the rhythm of year over year change in personal income devoid of transfer payments has been very highly correlated. If the June numbers are telling us small businesses are becoming more somber as they look into the second half of the year, then should we expect the rate of change in personal income to also contract (again, stripped of transfer payments)?

History tells us the answer is yes, as the NFIB series has historically led the year over year change in non-transfer payment related personal income growth. This is exactly why we suggested recently, despite our deep negativity regarding deficit spending, that in the absence of extended unemployment benefits retail sales and consumption in aggregate will slow over the remainder of the year. Is this what small businesses are "seeing" as they look ahead?


Three last charts and we'll call it a day in terms of the "tale of two economies" update. First, the tale of two economies theme plays out in highlight fashion in the top clip of the chart below. It's the ISM (large company) new orders subcomponent of the ISM series set against the NFIB business optimism numbers.

This is very highly directionally correlated until the clear departure seen in the current cycle. One issue to note is that in recent months these two data points have begun to move in much better directional harmony, as you can see. And why might that be? We personally believe it is because the bulk of the macro inventory rebuild cycle is over.

Inventory restocking will now be much more closely linked to demand/sales. And if inventory activity is any indication of business optimism, which we believe it is, we need to note that in the June NFIB report, inventory plans fell back into negative territory after a one month hiatus in the land of the positive. Although we'll spare you the chart, small business plans to add to inventory have been in negative territory now every single month since December of 2007 with the exception of May of this year.

That absolutely speaks to business confidence, or more correctly lack thereof and reinforces the tale of two economies theme playing out as we have seen inventory rebuilding in aggregate. Clearly it's the large companies that have driven the macro inventory rebuild. And we suggest this has been done with an eye to international sales.

The two bottom clips of the chart show us the divergence between hiring in the manufacturing sector relative to small business community hiring in aggregate. Please realize that the NFIB survey is dominated by service sector businesses. Manufacturers account for less than 15% of total respondents.

In the spirit of honesty and integrity, 20% of the NFIB respondents are involved in some form of construction. But the last time we checked, even these folks need jobs and personal income growth that is essentially the basis for macro economic expansion. And, we see the same dichotomy when look at the manufacturing ISM and non-manufacturing (service sector) ISM numbers and trends.


One last issue to keep in mind when looking at the ISM numbers is what is termed 'survivorship' bias. Companies formerly responding to the ISM surveys that are no longer around are not being "counted", so to speak. It's those that have survived and in all probability taken market share from the weak that dominate current period responses.

This is true in each cycle, but probably a good bit more pronounced in the current. So one question we must ask when looking at a series such as this is are current levels of response overstating strength? Again, just a bit of perspective.

Particularly disheartening for the small business community is the depth of lack of pricing power during the current cycle. The top clip of the next chart is clear on this observation. We've never seen anything like it. And certainly the only reason this is the case is that demand is the missing key ingredient for small businesses.

The top singular concern of NFIB respondents in June was "poor sales", as has been the case for many months now. Also after having emerged into the light of positive territory in recent months, June showed us a return trip to the dark side for forward small biz sales expectations. In the 2001 recession, small businesses blinked for one month concerning sales outlook. Night and day compared to the current cycle.


Without hesitation, we suggest that the above trends appear as they do because they are directly related to lack of job and income growth for households. If you ask us, this is a ground zero issue for investors ahead. Small businesses are clearly contributing to the deterioration in the macro, as exemplified by the ECRI numbers. Yet the micro of large company reported earnings is holding up for now.

Of course, large companies have the luxury of reporting "operating" (stripped of non-recurring costs which continue to grow) as opposed to actual earnings in the public venue. Is this why many a CEO and CFO are optimistic— because they can help 'shape' reported earnings outcomes? This is THE tension for investment decision making. And we're sorry to say it, but we do not believe this is going away anytime soon.

It will probably only be exacerbated as we venture into 2H 2010 and will surely be exacerbated in 2011 as tax rates go up. Moreover, recent legislation calling for producing 1099's for all corporate transactions over $600 is one of the largest negatives we can think of for small business. Not only does it add a layer of unreimbursed cost to small businesses, but will probably cause even large businesses to consolidate their supply relationships with smaller companies to avoid expensive bureaucratic and duplicative paperwork— a double negative for the small business community. Just what are politicians and the Administration thinking? Answer: They are not.

Finally, as we have heard it said a million times now in the mainstream media, lack of credit availability is hurting small business. A key source of business credit historically has been small community and to an extent regional banks. But these sources, licking their CRE wounds, are currently in no mood to lend. This is the key linkage between CRE outcomes and the small business community.

But, only 10% of small businesses said they were dissatisfied with credit availability in June. In fact, as per the top concerns of the small biz community, financing came in sixth. We strongly suggest lack of credit availability is not a key issue for small businesses, despite mainstream commentary to the contrary.

Maybe lack of credit availability to their customers (households), but not to themselves. So as we look at small business plans for capital spending, we do not believe this is being held back by credit availability, but is rather a statement of actual forward business outlook. Inventories and capital spending plans are the telltale real world and real time business confidence indicators. Both are down for the count relative to historical cycles.


Bottom line summary. The tale of two economies theme remains valid and intact for now. We are seeing a huge divergence between large and small business condition outlooks at present. A degree of divergence we have never seen in modern historical experience.

Large businesses represent the micro in terms of the positive of company specific earnings. They are the large S&P 500 companies whose earnings are more dependent on the rhythm of the global economy as opposed to the domestic US economy specifically. They are the large companies whose reported "operating" earnings are not falling apart, despite a few bumps in the road here and there.

Alternatively, we see the small business community as representing the domestic US macro. They are the job— and ultimately personal income— creators. They are largely the service sector, the largest driver of domestic US economic outcomes. The NFIB numbers are simply telling us of a deceleration in macro economic activity directly ahead. And herein lies the tension for investors.

What will be more important in decision making immediately ahead— the tone and rhythm of the US macro economy inclusive of jobs and personal income, or the micro of reported quarterly "operating" earnings of truly large and global-centric companies whose job and personal income creation activities largely lie abroad? It's why we need to remain focused on this "tales of two economies" theme. Is it really going to be the case that the S&P 500 companies alone (as a proxy for large corporations) experience a headline economic recovery in the current cycle, while small businesses never even leave the 'post recessionary' starting gate?

It's sure looking that way for now. In terms of "counting cards" as per a potential US 'double dip' recession outcome, the NFIB puts a checkmark in the plus column for the 'double dip' scenario. Just keepin' a list.

Why The Recession Ended

¹²Why The Recession Ended

By Dirk Van Dijk, CFA | 31 July 2010

In the wake of the collapse of Lehman Brothers, the related near-failure of Citigroup (C) and the shotgun weddings of J.P. Morgan (JPM) and Washington Mutual, Bank of America (BAC) with Merrill Lynch, and Wells Fargo (WFC) with Wachovia, there was an extraordinary policy response form both the Federal Reserve, and from the Federal Government. There were many facets of this response, although the two most prominent were the TARP and the Stimulus Act, or ARRA. The big question is what would have the economy looked like if the policy makers in the both the Bush and Obama administrations had sat back and done nothing. It is, of course, impossible to prove a counter-factual, but there are economic models that can be used to try to answer the question.

The Blinder-Zandi Paper

Alan Blinder, a professor at Princeton, and Mark Zandi of Moody's Economics (and one of the chief economic advisors to the McCain Campaign) have attempted to do just that. In a long— but very readable— paper (see here), they argue that without any of the responses, 2010 GDP would have been 11.5% lower than it is likely to turn out, payroll employment would have been 8.5 million lower and we would now be facing outright deflation rather then just being at risk of falling into it, as we are now). As for the Stimulus Act (although they do caution that disentangling the effects of all the moving parts of the government reaction is difficult), they estimate that it alone raised GDP by 3.4%, kept unemployment 1.5% lower than it would have been (in other words, U-3 unemployment would now be at 11.0% rather than at 9.5%) and saved or created 2.7 million jobs. Their findings on the effects of the ARRA are broadly consistent with the findings of the non-partisan Congressional Budget Office (CBO).

They say "We do not believe that it was a coincidence that the turnaround from recession to recovery occurred last summer, just as the ARRA was providing its maximum economic benefit." I have to agree with them. However, I was arguing during the debate over the ARRA that the proposed solution was too small, and needed to be substantially larger given just how messed up the economy was in the wake of the freezing up of the credit markets. Now the effects of the stimulus are wearing off, and— surprise, surprise— the economy is starting to slow again. However, there is not the political will to do anything about it at this point, or at least not enough political will to be able to muster the 60 votes needed in the Senate to overcome a filibuster to address the problem.

A Double-Dip?

However, the ARRA, along with the Fed keeping rates at very low levels, has been enough to partially prime the pump. Thus I don't think that we will be falling back into a double-dip recession, though the risks of it happening are increasing. We are much more vulnerable to an external shock pushing us back into a recession.

The emphasis on cutting spending right now to bring down the deficit is misguided and increases the risk of a double dip. That is exactly the policy followed by President Hoover in the Great Depression. The result was that most of the increase in the ratio of debt-to-GDP occurred under Hoover, not FDR. If austerity programs cause the economy to go into another recession, the deficit will end up being higher, not lower. Austerity right now will bring us all pain and no gain.

But Deficits Do Matter

Of course, we do have to address the long-term structural deficit. Ultimately, that comes down to bending the cost curve on health care costs. The Health Care reform bill did a little bit on that front, but not enough. Letting the Bush tax cuts on the wealthy expire will also help make a major dent in the long-term deficit. However, given the current fragile state of the economy, raising taxes makes no more sense than cutting spending.

Even so, a dollar of aid to state and local governments to prevent them from having to lay off teachers and police provides much more economic benefit than a dollar of lower taxes in the hands of someone who is already making $500,000 a year. The economy did just fine when the top tax rate was 39.5% under Clinton— much better than it did when it was at 35% under Bush. Still, we might want to phase-in the return to Clinton-era tax rates over two or three years rather than doing it all at once in a fragile economy.

The Blinder-Zandi paper is very interesting, and is well worth reading.

ECRI Falls Deeper Into The Abyss

¹²ECRI Falls Deeper Into The Abyss

By BondSquawk | 30 July 2010

The Economic Cycle Research Institute released its Weekly Leading Indices for the week ending July 23. While the Weekly Leading Index ticked up to 121.1 from a downward revised prior period reading of 120.6, the Weekly Growth Rate Index fell further by 0.2% to -10.7 percent. This latest reading marks the 12th decline in a row and the 8th straight week in negative territory, dating back to the first week in June.

The ECRI Weekly Leading Index

By Dshort | 30 July 2010

Note from dshort: This week's update coincides with the release of Q2 GDP, which came in light at 2.4%. Note also that the Real GDP numbers are now updated with the BEA's revised estimates from 2007 through First Quarter 2010. See the explanation here.

Today the Weekly Leading Index (WLI) of the Economic Cycle Research Institute (ECRI) registered negative growth for the eighth consecutive week, coming in at -10.7. This number is based on data through July 23th. The rate of decline from the peak in October 2009 is unprecedented since the metric was first devised in 1967. But before we examine the WLI further, let's first review the relationship between the Gross Domestic Product (GDP) and recessions since 1965. The conventional definition of a recession is two or more consecutive quarters of negative growth. The National Bureau of Economic Research (NBER), charged with establishing official recession start and end dates, doesn't follow convention in making its recession calls— often a year or more after the fact. [[It has not so far identified the end of the recession which 'officially' started in December 2007.: normxxx]]


Click Here, or on the image, to see a larger, undistorted image.


A Leading Indicator For Recessions?

The ECRI WLI growth metric has had a respectable (but by no means perfect) record for forecasting recessions. The next chart shows the correlation between the WLI, GDP and recessions.


Click Here, or on the image, to see a larger, undistorted image.


A significant decline in the WLI has been a leading indicator for six of the seven recessions since the 1960s. It lagged one recession (1981-1982) by nine weeks. The WLI did turned negative 17 times when no recession followed, but 14 of those declines were only slightly negative (-0.1 to -2.4) and most of them reversed after relatively brief periods.

Three of the false negatives were deeper declines. The Crash of 1987 took the Index negative for 68 weeks with a trough of -6.8. The Financial Crisis of 1998, which included the collapse of Long Term Capital Management, took the Index negative for 23 weeks with a trough of -4.5. The third significant false negative came near the bottom of the bear market of 2000-2002, about nine months after the brief recession of 2001. At the time, the WLI seemed to be signaling a 'double-dip' recession, but the economy and market accelerated in tandem in the spring of 2003 [[after huge stimulus by President W. Bush and the Fed: normxxx]], and a recession was avoided.

The Latest WlI Decline

The question, of course, is whether the latest WLI decline is a leading indicator of a recession or a false negative. The index has never before dropped to the current level without the onset of a recession. The deepest decline without a near-term recession was in the Crash of 1987, when the index slipped to -6.8. The next chart includes an overlay of the Federal Funds Rate.


Click Here, or on the image, to see a larger, undistorted image.


Can the Fed take steps to reduce the risk of a near-term recession? Lowering the Fed Funds rate has been a primary tool for stimulating a weak economy. But as the last chart shows, that tool is not any longer available in our current situation.

Echos Of A Forgotten Argument

¹²Echos Of The 1930's: Insufficient Aggregate Demand For A World Swimming In Goods?

By Bill Gross | August 2010

[The] message this month is an adjunct to the New Normal that will likely impact growth and financial markets for years to come. Our New Normal, to repeat ad nauseam, is predicated upon deleveraging, reregulation and deglobalization, all of which promote slower economic growth and lower inflation in developed economies while substantially bypassing emerging market countries that have more favorable initial conditions. In recent months, Mohamed El-Erian has added a developing corollary that emphasizes the lack of an appropriate policy response to what is a structural as opposed to a cyclical development, and you should read his frequently published op-eds for a more thorough analysis as well as those written by Jeffrey Sachs and others who are constructively suggesting a way back to the old normal.

That return journey will be all the more difficult to accomplish, however, because of demographics, an influence that much like gravity is hard to see but whose effect is all too powerful. Demographics— or in this case population growth— is so long term in its influence that economists and observers are inclined to explain the functioning of economic society without ever factoring in the essential part that it plays in growth. Production depends upon people, not only in the actual process, but because of the final demand that justifies its existence. The more and more consumers, the more and more need for things to be produced. I will go so far as to say that not only growth but capitalism itself may be in part dependent on a growing population.

Our modern era of capitalism over the past several centuries has never known a period of time in which population declined or grew less than 1% a year. Currently, the globe is adding over 77 million people a year at a pace of 1.15% annually, but slowing. Still, that's 77 million more mouths to feed, 77 million more pairs of shoes to make, 77 million more little economic units of demandhouses, furniture, cars, roads, oil— more, more, more.

Capitalism, I would assert, thrives on more, more, and more, but does not do so well when there is 'less' or an expectation of 'less'. This is not the Malthusian thesis, which maintained that at some point the world would run out of food to satisfy a growing population; it is an assertion that capitalism depends upon final demand and that if there ever comes a time when population growth slows, then the world's most efficient economic system will be tested. If anything, my thesis is anti-Malthusian in its assertion that there will always be enough production to satisfy a growing population, but perhaps not enough new people to sustain [a relentlessly] growing production.

Observers will point out, as shown in the following chart, that global population growth rates have been declining since 1970 with no apparent ill effects. True, until 2008, I suppose. [But] the fact is that since the 1970s we have never really experienced a secular period during which the private market could effectively run on its own engine without artificial asset price stimulation. The lack of population growth was likely a significant factor in the leveraging of the developed world's financial systems and the ballooning of total government and private debt as a percentage of GDP from 150% to over 300% in the United States, for example.

Lacking an accelerating population base, 'developed' countries promoted the financing of more and more consumption per capita in order to maintain existing GDP growth rates. Finally, in the U.S., with consumption at 70% of GDP and a household sector deeply in debt, there was nowhere to go but down. Similar conditions exist in most developed economies.

The danger today, as opposed to prior deleveraging cycles, is that the deleveraging is being attempted into the headwinds of a structural demographic downwave as opposed to a decade of substantial population growth. Japan is the modern-day example of what deleveraging in the face of a slowing and now negatively growing population can do. Prior deleveraging periods such as that which the U.S. and European economies experienced in the 1930s exhibited a similar demographic with the lowest levels of fertility in the 20th century and extremely low population growth.

And things did not go well then. Today's developed economies almost assuredly offer substantially less population growth than the 1.5% rate experienced over the prior 50 years. Even when viewed from a total global economy perspective, population growth over the next 10–20 years will barely exceed 1%.

The preceding analysis does not even begin to discuss the aging of this slower-growing population base itself. Japan, Germany, Italy and of course the United States, with its boomers moving toward their 60s, are getting older year after year. Even China with their previous one baby policy faces a similar demographic. And while older people spend a larger percentage of their income— that is, they save less and eventually 'dissave'— the fact is that they spend far fewer dollars per capita than their younger counterparts.

No new homes, fewer vacations, less emphasis on conspicuous consumption and no new cars every few years. Healthcare is their primary concern. These aging trends present a one-two negative punch to our New Normal thesis over the next 5–10 years: fewer new consumers in terms of total population, and a growing number of older ones who don't spend as much money. The combined effect will slow economic growth more than otherwise.

PIMCO's continuing New Normal thesis of deleveraging, reregulation and deglobalization produces structural headwinds that lead to lower economic growth as well as half-sized asset returns when compared to historical averages. The New Normal will not be aided nor abetted by a slower-growing population nor by cyclical policy errors that thrust Keynesian consumption remedies on a declining consumer base. Current deficit spending that seeks to maintain an artificially high percentage of consumer spending can be compared to flushing money down an economic toilet.

Far better to create and mimic other government industrial policies aimed at infrastructure, clean energy, more relevant education and less costly healthcare services. Until we do, policymakers will continue to wave their hands in front of the electronic eye of the (failed) automated toilet– waiting for the flush, waiting for the flush, waiting for the flush— with very little success. Try another way, Washington. El-Erian, Sachs and other 21st century policy thinkers have a better way to push the handle for the flush.

ߧ

Normxxx    
______________

The contents of any third-party letters/reports above do not necessarily reflect the opinions or viewpoint of normxxx. They are provided for informational/educational purposes only.

The content of any message or post by normxxx anywhere on this site is not to be construed as constituting market or investment advice. Such is intended for educational purposes only. Individuals should always consult with their own advisors for specific investment advice.

Friday, July 30, 2010

Alphabet Soup: The 'New' Normal

¹²Alphabet Soup: The 'New' Normal

By Bill Gross, Pimco | July 2010

Global financial market returns stand at the threshold of mediocrity. With bonds priced not for recession but near depression, most major global bond indices now yield less than 3%, surely a forerunner of returns to come. Stocks, long the volatile vamp of investor optimism, have not yet adjusted to the New Normal of half-size economic growth induced by deleveraging, reregulation, and deglobalization and have low single digit prospects as well. Yet, what has seemed obvious to those of us collectively at PIMCO for several years now is less than standard fare in the trading rooms of institutional money managers.

While the phrase "New Normal" has been welcomed into the lexicon of reporters and commentators alike, the willingness of investors to accept its realities is fog-ridden and whispered, or perhaps softly whistled, much like midnight passersby at a graveyard. Our "New Normal" two-word duality seems to resonate more on the "normal" than the "new" to economists whose last names aren't Roubini, Reinhart, Rogoff, or Rosenberg. It's as if "R" has been eliminated from the financial alphabet, and "new" from investors' dictionaries worldwide.

Perhaps the enigma arises from a multi-generational acceptance of debt as 'common scrip', available simply for the asking and seemingly forever productive in boosting living standards— until, that is, liabilities became so large that the interest burden and probability of repayment overwhelmed borrower and lender alike in near unison. To understand why debt may have become a burden instead of a boon, it is instructive— as Philip Coggan points out in a recent Economist article— to ask why people, companies and countries borrow in the first place.

They do so, he intelligently argues, to boost their standard of living, to bring consumption forward instead of languishing in the present. How could almost any of us have afforded a home without a mortgage? By the time we would have saved enough money we'd have been close to retirement with the kids grown and facing a similar predicament. And so we turned to the wizardry of borrowing on time to be able to purchase and then repay in full. Crucially, since debt is a handshake between at least two parties, the lender had to believe that it would be repaid, and that belief or "credere," was based on several rather 'rational' expectations when observed on a macro level from 30,000 feet.

First of all, capitalistic innovation fostered productivity, and an increasing standard of living through technology and innovation. Debts could be paid back via profits and higher wages if only because of rising prosperity itself. Secondly, the 20th century, which fathered the debt supercycle, was a time of global population growth despite its interruption by tragic world wars and periodic pandemics. Prior debts could be spread over an ever-increasing number of people, lessening the burden and making it possible to assume even more debt in a seemingly endless cycle which brought consumption forward— anticipating that future generations could do the same.

But while technological innovation— much like Moore's law— seems to have endless promise, population growth in numerous parts of the developed world is approaching a dead end. Not only will it become more difficult to transfer high existing debt burdens onto the smaller shoulders of future generations, but the overlevered, aging "global boomers" themselves will demand a disproportionate piece of stunted future goods and services— without, it seems, the ability to pay for it. Creditors, sensing the predicament, hold back as they recently have in Greece and other southern European peripherals, or in the U.S. itself, as lenders demand larger down payments on new home mortgages, and other debt extensions.

Aging and population change of course are just part of the nemesis. We could have "saved" for this moment much like squirrels in wintertime but humanity's free will is infected with greed, avarice and, in a majority of instances, hope as opposed to commonsense. We overdid a good thing and now the financial reaper is at the door, scythe and financial bill in one hand, with the other knocking on door after door of previously unsuspecting households and sovereigns to initiate a "standard of living" death sentence.

What is harder to understand, in this demographic/psychological/sociological explanation of the crisis, is why it should morph into a global phenomenon. There are 6.5 billion people in the world and will soon be 1 billion more. Many of them are debt-free and have never used a credit card or assumed a home mortgage. Why can't lenders like PIMCO lend to them, allowing developing nations to bring their consumption forward, developed nations to supply the goods and services, and the world to resume its "old normal" path toward future profits, prosperity and increasing standard of living? To a certain extent, that is what should gradually happen, promoting more rapid growth in the emerging nations and a subdued semblance of it in the G-7— a "new normal".

But they— the developing nations— are not growing fast enough, at least internally, to return global growth to its old standards. Their financial systems are immature and reminiscent of a spindly-legged baby giraffe, having lots of upward potential but still striving for balance after a series of missteps, the most recent of which was the Asian crisis over a decade ago. And so they produce for export, not internal consumption, and in the process leave a gaping hole in what is known as global aggregate demand. Developed nation consumers are maxed out because of too much debt, and developing nations don't trust themselves to stretch their necks for the delicious leaves of domestic consumption just above.

It is this lack of global aggregate demand— resulting from too much debt in parts of the global economy and not enough in others— that is the essence of the problem, which only economists with names beginning in R seem to understand (there is no R in PIMCO no matter how much I want to extend the metaphor, and yes, Paul _Rugman fits the description as well!). If policymakers could act in unison and smoothly transition maxed-out indebted consumer nations into future producers, while simultaneously convincing lightly indebted developing nations to consume more, then our predicament would be manageable. They cannot. G-20 Toronto meetings aside, the world is caught up as it usually is in an "every nation for itself" mentality, with China taking its measured time to consume and the U.S. refusing to acknowledge its necessity to invest in goods for export.

Even if your last name doesn't begin with R, the preceding explanation is all you need to know to explain what is happening to the markets, the global economy, and perhaps your own wobbly-legged standard of living in recent years. Consumption when brought forward must be financed, and that financing is a two-way bargain between borrower and creditor. When debt levels become too high, lenders balk and even lenders of last resort— the sovereigns, the central banks, the supranational agencies— approach limits beyond which private enterprise's productivity itself is threatened.

We have arrived at a New Normal where, despite the introduction of 3 billion new consumers over the past several decades in "Chindia" and beyond, there is a lack of global aggregate demand or perhaps an inability or unwillingness to finance it. Slow growth in the developed world, insufficiently high levels of consumption in the emerging world, and seemingly inexplicable low total returns on investment portfolios— bonds and stocks— lie ahead. Stop whispering (and start shouting) the words "New Normal" or perhaps begin to pronounce your last name with an RRRRRRRRRRRR. Our global economy, our use of debt, and our financial markets have changed— not our alphabet or dictionary.

Thursday, July 29, 2010

The 2nd Half Slowdown

¹²The 2nd Half Slowdown

By CalculatedRisk | 29 July 2010
[ Normxxx Here:  Alternatively, the 'slowdown' may just feel like another recession…  ]
There are several analysts forecasting GDP growth to pick up in the 2nd half of this year, with annual GDP growth of over 4% for 2010 (the advance Q1 GDP estimate was 3.2%, so over 4% for 2010 would require a nice pick up in the 2nd half). This is not a "v-shaped" recovery— that didn't happen— but these forecasts are still above trend growth. Unfortunately I think we will see a slowdown in the 2nd half of the year, but still positive growth. Last year I argued for a 2nd half recovery and that was more fun!

Here are a few reasons I think the U.S. economy will slow:

1) The stimulus spending peaks in Q2, and then declines in the 2nd half of 2010. This will be a drag on GDP growth in the 2nd half of this year.

2) The inventory correction that added 3.8% to GDP in Q4, and 1.6% to GDP in Q1, has mostly run its course.

3) The growth in Personal Consumption Expenditures (PCE) in Q1 came mostly from less saving and transfer payments, as opposed to income growth. That is not sustainable, and future growth in PCE requires jobs and income growth. Although I expect employment to increase, I think the job market will recover slowly (excluding temporary Census hiring) because the key engine for job growth in a recovery is residential investment (RI)— and RI has stalled (until the excess housing inventory is reduced). [[But we are looking at several years before that last happens!: normxxx]]

4) There is a slowdown in China, and Europe has some problems (if no one noticed), and that will probably impact export growth and also negatively impact one of the strongest U.S. sectors— manufacturing (when was the last time manufacturing was one of the strongest sectors?)

Of course monetary policy is still supportive and it is unlikely the Fed will sell assets or raise the Fed Funds rate this year. Maybe some commodities like oil will be cheaper and give a boost to the U.S. economy; maybe the saving rate will fall further and consumption will continue to grow faster than income; maybe residential investment will pick up sooner than I expect— maybe. But this suggests a 2nd half slowdown to me.

Daily Consumer Leading Indicators

¹²Consumer Metrics Institute: Home Of Daily Consumer Leading Indicators
[ Normxxx Here:  According to these statistics, we are already well into the second leg (dip?) of the recession…  ]
"Bringing the measurements of critical economic activities into the twenty-first century by mining tracking data for an understanding of what American consumers were doing yesterday."

Growth Index Past 4 Years(1):


Click Here, or on the image, to see a larger, undistorted image.


Notes:
(1) The Consumer Metrics Institute's 91-day 'Trailing Quarter' Growth Index -vs— U.S. Department of Commerce's Quarterly GDP Growth Rates over past 4 years. The quarterly GDP growth rates are shown as 3-month plateaus in the graph. The Consumer Metrics Institute's Growth Index is plotted as a monthly average. Please see our Frequently Asked Questions page for a more complete description of our Growth Index.

Consumer Metrics Institute's Contraction Watch(2):


Click Here, or on the image, to see a larger, undistorted image.


Notes:
(2) The comparison of the 91-Day Growth Indexes during the 'quarter' immediately following the commencement of a contraction. The quarterly GDP growth rates are shown as 3-month plateaus in the graph. The Consumer Metrics Institute's Growth Index is plotted as a monthly average. The contraction events of 2006, 2008 and 2010 are shown against the same scale of annualized contraction.

July 26, 2010— Daily Growth Index Surpasses 3% Contraction Rate:

Since last week our Daily Growth Index has weakened further, surpassing a year-over-year contraction rate of 3%. This daily measurement of on-line consumer demand for discretionary durable goods has now dropped to the lowest level it has recorded since late November 2008:


Click Here, or on the image, to see a larger, undistorted image.


Our Daily Growth Index reflects the strength of consumer demand over the trailing 91-day 'quarter', weighted according to the contribution that goods involved in on-line transactions make to the GDP (per the BEA's NIPA tables). It is designed to serve as a proxy for a 'real-time' GDP, and it slipped into net contraction on January 15th, 2010. To put this decline in perspective we offer the following observations:

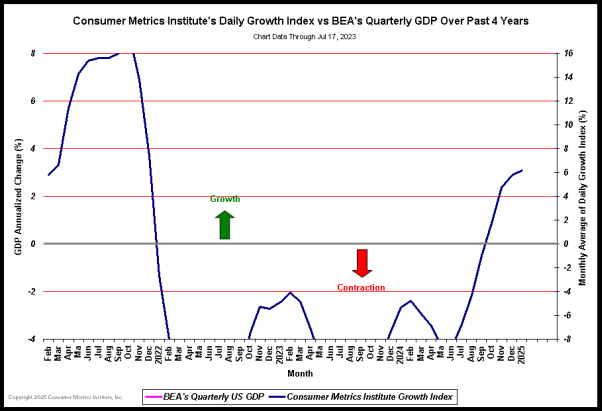
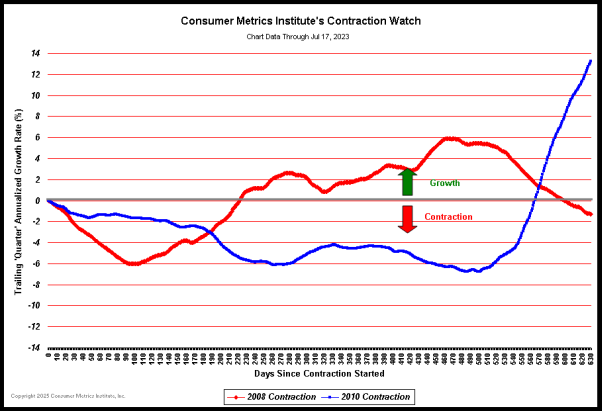
The current contraction in consumer demand for discretionary durable goods has now extended for more than 6 months.

The day to day level of the year-over-year contraction is now worse than a similar reading of the 'Great Recession' of 2008 was after 6 months.


Click Here, or on the image, to see a larger, undistorted image.


The amount of damage done to an economy by an economic slowdown can be quantified by multiplying the event's average rate of contraction times the duration of the event. By that measure the 2010 contraction has now inflicted 43% as much pain on the economy during its first 6 months as the 'Great Recession' did during the first 6 months of that slowdown.

Although this contraction has not yet reached the extreme contraction rates that were seen during 2008, after 6 months it has not yet formed a bottom. Furthermore, it is now likely to last longer than the 2008 event.

In an even broader perspective, the current level of the Daily Growth Index over the trailing 91-day 'quarter' would put it among the lowest 6% of all calendar quarters of GDP growth since 1947. Only roughly 1 in 17 quarters of GDP activity have been worse.

The duration of the current contraction event is becoming a real problem. Our trailing 183-day 'two consecutive quarters' growth index has dropped into the 5th percentile among similar two consecutive quarters of GDP 'growth' since 1947. This means that the trailing 6 months have been statistically worse than the trailing 3 months— less than one in twenty 6-month spans have been worse since the BEA began keeping quarterly records.

Our Housing Sector Index has been volatile recently, swinging as much as 10% in less than two weeks. These kinds of swings have also shown up in media reports on home sales:


Click Here, or on the image, to see a larger, undistorted image.


A substantial portion of that volatility has been the result of recently renewed interest in the refinancing of existing owner occupied residential mortgages:


Click Here, or on the image, to see a larger, undistorted image.


When that upturn in recent refinancing activity is compared to a similar chart for consumer interest in loans for the initial purchase of new or existing residences, a clear divergence can be seen:


Click Here, or on the image, to see a larger, undistorted image.


Although our Housing Index reacts on a day to day basis to both types of loan activities, it is probable that in the current economic environment they are making very different contributions to economic growth. That wasn't true as little as three years ago, when refinancing activities were an economic engine of growth, cashing out homeowner equity and reinvesting it in home improvements or other durable goods.

In contrast, today's refinancing activities are much less likely to result in increased leverage and surplus cash. In fact, much of the refinancing activity may be resulting in deleveraged loans and 'cash-ins' to maintain conforming LTV ratios. All of this activity may simply be the result of homeowners seeking to lock in historically low mortgage rates, while deploying available cash into long term 'investments' with relatively high yield-to-risk ratios. In any event, we would read any upward volatility in our Housing Index with caution until consumer demand for initial purchase home loans significantly improves.

At the Consumer Metrics Institute we measure day-by-day changes in the discretionary durable goods transactions of internet shopping consumers. We genuinely believe that the real economy lives where 'Main Street' consumers are (figuratively and/or literally) clicking 'Add to Shopping Cart', not where the GDP's factories slavishly follow the consumer's lead. The millions of consumers we measure each day respond collectively to what they see going on in their own local economy, with their own family and with their own friends. And right now, real-world 'Main Street' consumers are demonstrating substantial caution.

Note: A more complete list of historical Commentary can be found on our History Page

Wednesday, July 28, 2010

Modern Portfolio Theory

¹²The Benefits Of Modern Portfolio Theory

By Charles Rotblut | 28 July 2010

There is a secret to investing that many investors are never told: You can achieve higher returns and reduce your portfolio's level of risk at the same time. Yes, you read that right, higher returns and lower risk are both possible. This is not a magic formula designed by someone to sell you a get-rich-quick scheme. Rather, the creator of this strategy was awarded a Nobel Prize in economics.

Join AAII

Charles Rotblut, CFA, is a vice president at AAII and editor of the AAII Journal. Follow him on Twitter at twitter.com/charlesrotblut.

Modern Portfolio Theory

In 1952, Harry Markowitz wrote an essay titled "Portfolio Selection" that became the basis for 'modern portfolio theory'— MPT. Modern portfolio theory holds that when various uncorrelated assets are combined in a portfolio, return is improved and risk is lowered. The risk level of the individual security does not matter as long as its return varies from the other securities in the portfolio.

When constructing a portfolio, you could opt for an extremely low-risk, but [ultimately] unsatisfactory long-term portfolio by holding only short-term government bonds. At the other extreme, you could create a long-term portfolio comprised of only high-growth stocks. Between these two extremes are portfolios that contain just the right mix of assets. In other words, you want a portfolio with assets and securities that complement each other.

The Efficient Market Frontier

Markowitz formulated that there is a line at which a portfolio produces the ideal amount of return for a given level of risk: This is known as the efficient market frontier. It shows whether a portfolio is taking on too much risk for a given a level of return. It can also reveal whether or not a portfolio is achieving a high enough return for the amount of risk it is taking.

The 'efficient market frontier' is curved. The reason is that there is a point of diminishing performance relative to risk. After a certain point, the amount of additional return diminishes as the level of risk is increased. Similarly, a portfolio that is too conservative does not even generate enough return to compensate for its inherent low risk.

Putting Theory Into Action

The goal for investors is to build a portfolio out of uncorrelated assets and securities— this holds true regardless of your risk tolerance. I will give you two examples.

First, investors who are risk-averse will want to allocate the majority of their portfolios to bonds or bond mutual funds. The types of bonds included in the portfolio should have differing maturity dates, varying issuers (Treasury, municipal, corporate, international, etc.) and various credit ratings. A smaller portion of the portfolio should be allocated to other asset classes (e.g., stocks) to provide protection against inflation and periods of rising interest rates.

Second, investors with a higher tolerance for risk will want to allocate the majority of their portfolios to stocks. The equity portion should mix various sectors and industries, styles (growth and value), market capitalizations (small, mid and large), and geographic regions (domestic, Europe, Asia and Latin America). A smaller portion of the portfolio should be allocated to other asset classes (e.g., bonds) to provide protection against bear markets as well as a stream of income.

The examples above used stocks and bonds. In both examples, the idea is to lower the risk by combining several different types of securities. This moves the portfolio closer to the efficient market frontier by enabling it to benefit from several market forces instead of just one or two.

Other Considerations

A truly diversified portfolio should include other asset classes as well, such as real estate and commodities. In both cases, owning the physical asset (e.g., actual land or bullion) provides more diversification than a real estate investment trust REIT or mining company. (However, a REIT or shares of a mining company would be easier to buy and sell.)

During times of financial distress, correlations of different asset classes can move toward 1.0, meaning they move in the same direction. This occurred during the bear market of 2007–2009. But even when all classes become seemingly correlated, the actual level of loss will differ from the decline that would have been experienced if the portfolio were invested in a single asset class. [[Moreover, as seen in 2009, once past the 'panic', the different asset classes will quickly become meaningfully uncorrelated once again.: normxxx]]

Tuesday, July 27, 2010

Some Thoughts On Deflation

¹²Some Thoughts On Deflation

By John Mauldin | 24 July 2010

The Super-Trend Puzzle
The Elements of Deflation

The debate over whether we are in for inflation or deflation was alive and well at the Agora Symposium in Vancouver this this week. It seems that not everyone is ready to join the deflation-first, then-inflation camp I am currently resident in. So in this week's letter we look at some of the causes of deflation, the elements of deflation, if you will, and see if they are in ascendancy. For equity investors, this is an important question because, historically, periods of deflation have not been kind to stock markets. Let's come at this week's letter from the side, and see if we can sneak up on some answers.

Even on the road (and maybe especially on the road, as I get more free time on airplanes) I keep up with my rather large reading habit. This week, the theme in various publications was the lack of available credit for small businesses, with plenty of anecdotal evidence. This goes along with the surveys by the National Federation of Independent Businesses, which continue to show a difficult credit market.

Businesses are being forced to scramble for needed investments, generally having to make do with cash flow and working out of profits. This is an interesting quandary for government policy makers, as 75% of the "rich" that will see the Bush tax cuts go away are small businesses. There was a great graphic (that I now cannot find) showing that all net new jobs of the past two decades have come from small businesses and start-ups. And yet as of now, when structural employment is over 10% (if you count those who were considered to be in the work force just a few months ago), we [plan] to reduce the availability of revenues to the very people we want to be hiring new workers, and who are cash-starved as it is.

It is not just that taxes will go from 35% to just under 40%. It is the increase in Medicare taxes coming down the pike, too. We are taking money from private hands, where it has the potential to increase productivity, and putting it into government hands, where it will do nothing for growth of the economy. There is no 'multiplier' for government spending. And tax increases reduce potential GDP by a multiplier of at least 1 and maybe 3, depending on which study you want to cite.

I understand that taxes have to go up. I get it. But we would be better off having a discussion of where we want those tax dollars to come from before we risk hurting an economy that will barely be growing at 2% in the 4th quarter, and may be well below that. It is the increase in taxes that has me concerned about a double-dip recession.

That being said, the announcement by several prominent Democratic senators that they think we should extend the Bush tax cuts is significant. As I said a few weeks ago, we should not experience a double-dip recession absent policy mistakes. A slow-growth world, yes. But an actual double dip is rare.

If Congress were to extend the Bush tax cuts for at least a year, until the presidential commission on taxes is done with its work and THEN have the debate, it would make me far more optimistic. And it would be quite bullish for stocks, I think. Businesses would know how to plan, at least, for a year, and the economy would be given more time to actually recover. I am not ready to channel my inner Larry Kudlow, but from what we see this summer it would make me more optimistic and reduce the chances of a double-dip recession significantly.

Inflation in the US is now just below 1%, whether you look at the CPI, the Cleveland Fed's measure, or the Dallas Trimmed Mean CPI. The Fed's favorite, the PCE, is also approaching 1%. The Dallas numbers are a little behind, but they are at all-time lows. The classic definition of deflation is an economic environment that is characterized by inadequate or deficient aggregate demand. Prices in general fall, and normal economic relationships start to fall apart.


The Super-Trend Puzzle

I am a big fan of puzzles of all kinds, especially picture puzzles. I love to figure out how the pieces fit together and watch the picture emerge, and have spent many an enjoyable hour at the table struggling to find the missing piece that helps make sense of the pattern. Perhaps that explains my fascination with economics and investing, as there are no greater puzzles (except possibly the great theological conundrums, or the mind of a woman, about which I have only a few clues). The great problem with the economic puzzles is that the shapes of the pieces can and will change as they rub against one another. One often finds that fitting two pieces together changes the way they meld with the other pieces you thought were already nailed down, which may of course change the pieces with which they are adjoined; and suddenly your neat economic picture no longer looks anything like the real world.

(Which is why all of the mathematical models make assumptions about variables that allow the models to work, except that what they end up showing is not related to the real world, which is not composed of static variables.)

There are two types of major economic puzzle pieces. The first are those pieces that represent trends that are inexorable: they will not themselves change, or if they do it will be slowly; but they will force every puzzle piece that touches them to shift, due to the force of their power. Demographic shifts or technology improvements over the long run are examples of this type of puzzle piece.

The second type is what I think of as "balancing trends," or trends that are not inevitable but which, if they come about, will have significant implications. If you place that piece into the puzzle, it too changes the shape of all the pieces of the puzzle around it. And in the economic super-trend puzzle, it can change the shape of other pieces in ways that are not clear.

Deflation is in the latter category. I have often said that when you become a Federal Reserve Bank governor, you are taken into a back room and are given a DNA transplant that makes you viscerally and at all times opposed to deflation. Deflation is a major economic game changer. You can argue, as Gary Shilling does, that there is a 'good' kind of deflation, where rising productivity and other such good things produces a general fall in prices, such as we had in the late 19th century. And as we have experienced that in the world of technology, where we view it as normal that the price of a computer will fall, even as its quality rises over time.

But that is not the kind of deflation we face today. We face the deflation of the Depression era, and central bankers of the world are united in opposition. As Paul McCulley quipped to me this spring, when I asked him if he was concerned about inflation, with all the stimulus and printing of money we were facing, "John," he said, "you better hope they can cause some inflation". And he is right. If we don't have a problem with inflation in the future, we are going to have far worse problems to deal with.

Saint Milton Friedman taught us that inflation is always and everywhere a monetary phenomenon. That is, if the central bank prints too much money, inflation will ensue. And that is true, up to a point. A central bank, by printing too much money, can bring about inflation and destroy a currency, all things being equal. But that is the tricky part of that equation, because not all things are equal. The pieces of the puzzle can change shape. When the elements of deflation combine in the right order, the central bank can print a boatload of money without bringing about inflation. And we may now be watching that combination come about.

The Elements Of Deflation

Just as every school child knows that water is formed by the two elements of hydrogen and oxygen in a very simple combination we all know as H2O, so deflation has its own elements of composition. Let's look at some of them (in no particular order).

First, there is excess production capacity. It is hard to have pricing power when your competition also has more capacity than he wants, so he prices his product as low as he can to make a profit, but also to get the sale. The world is awash in excess capacity now. Eventually we either grow the economy to utilize that capacity or it will be taken offline through bankruptcy, a reduction in capacity (as when businesses lay off employees), or businesses simply exiting their industries.

I could load the rest of the letter with charts showing how low world capacity utilization is, but let's just take one graph, from the US. Notice that capacity utilization is roughly in an area that we associate with the bottom of past recessions (with one exception).


Deflation is also associated with massive wealth destruction. The credit crisis certainly provided that element. Home prices have dropped in many nations all over the world, with some exceptions, like Canada and Australia. Trillions of dollars of "wealth" have evaporated, no longer available for use. Likewise, the bear market in equities in the developed world has wiped out trillions of dollars in valuation, resulting in rising savings rates as consumers, especially those close to a wanted retirement, try to repair their leaking balance sheets.

And while increased saving is good for an individual, it calls into play Keynes' Paradox of Thrift. That is, while it is good for one person to save, when everyone does it, it decreases consumer spending. And decreased consumer spending (or decreased final demand, in economic terms) means less pricing power for companies.

Yet another element of deflation is the massive deleveraging that comes with a major credit crisis. Not only are consumers and businesses reducing their debt, banks are reducing their lending. Bank losses (at the last count I saw) are over $2 trillion and rising.

As an aside, the European bank stress tests were a joke. They assumed no sovereign debt default. Evidently the thought of Greece not paying its debt is just not in the realm of their thinking. There were other deficiencies as well, but that is the most glaring. European banks are still a concern unless the ECB goes ahead and buys all that sovereign debt from the banks, getting it off their balance sheets.

When the money supply is falling in tandem with a slowing velocity of money, that brings up serious deflationary issues. I have dealt with that in recent months, so I won't bring it up again, but it is a significant element of deflation. And it is not just the US. Global real broad money growth is close to zero. Deflationary pressures are the norm in the developed world (except for Britain, where inflation is the issue).


Falling home prices and a weak housing market are one more element of deflation. This is happening, and not just in the US— much of Europe is suffering a real estate crisis. Japan has seen its real estate market fall almost 90% in some cities, and that is part of the reason they have had 20 years with no job growth and a nominal GDP where it was 17 years ago.

In the short run, reducing government spending (in the US at local, state, and federal levels) is deflationary in the short run. Martin Wolfe, in the Financial Times, wrote the following last week (arguing that that the move to "fiscal austerity" is ill-advised):

"We can see two huge threats in front of us. The first is the failure to recognize the strength of the deflationary pressures The danger that premature fiscal and monetary tightening will end up tipping the world economy back into recession is not small, even if the largest emerging countries should be well able to protect themselves. The second threat is failure to secure the medium-term structural shifts in fiscal positions, in management of the financial sector and in export-dependency, that are needed if a sustained and healthy global recovery is to occur."

Finally, high and chronic unemployment is deflationary. It reduces final demand as people simply don't have the money to buy things [[and are willing to work at much reduced wages: normxxx]].

Yet, deflation that comes from increased productivity is desirable. In the late 1800's the US went through an almost 30-year period of deflation that saw massive improvements in agriculture (the McCormick reaper, etc.) and the ability of producers to get their products to markets through railroads. In fact, too many railroads were built and a number of the companies that built them collapsed. Just as we experienced with the fiber-optic cable build-out, there was soon too much railroad capacity, and freight prices fell. That was bad for the shareholders but good for consumers. It was a time of great economic growth.

But deflation that comes from a lack of pricing power and lower final demand is not good. It hurts the incomes of both employer and employee, and discourages entrepreneurs from increasing their production capacity, and thus employment. That is why it will be important to watch the CPI numbers even more closely in the coming months. The trend, as noted above, is for lower inflation. If that continues, the Fed will act. I did a summary of Bernanke's 2002 speech on deflation a few weeks ago.

If the US gets into outright deflation, I expect the Fed to react by increasing their assets and by outright monetization, buying treasuries from insurance and other companies, as putting more money into banks when they are not lending does not seem to be helpful as far as deflation is concerned. More mortgages? Corporate debt? Moving out the yield curve? All are options the Fed will consider. We need to be paying attention.

One final thought before I hit the send button. Recessions are by definition deflationary. One of the things we learned from This Time is Different by Rogoff and Reinhart is that economies are more fragile and volatile and that recessions are more frequent after a credit crisis. Further, spending cuts are better than tax increases at improving the health of an economy after a credit crisis.

I think we can take it as a given that there is another recession in front of the US. That is the natural order of things. But it would be better to have that inevitable recession as far into the future as possible, and preferably with a little inflationary cushion and some room for active policy responses. A recession next year would be problematic, if not catastrophic. Rates are as low as they can go. Higher deficits are not in the cards. Yet unemployment would shoot up and tax collections go down at all levels of government.

That is why I worry so much about taking the Bush tax cuts away when the economy is weak. Now, maybe those who argue that tax increases don't matter are right. They have their academic studies. But the preponderance of work suggests their studies are flawed and at worst are guilty of data mining (looking for data that supports your already-developed conclusions.)

Professor Michael Boskin wrote today in the Wall Street Journal:

"The president does not say that economists agree that the high future taxes to finance the stimulus will hurt the economy. (The University of Chicago's Harald Uhlig estimates $3.40 of lost output for every dollar of government spending.) Either the president is not being told of serious alternative viewpoints, or serious viewpoints are defined as only those that support his position. In either case, he is being ill-served by his staff."

As noted at the beginning of this letter, I find it very encouraging that there is a movement among Democrats to think about at least postponing the demise of the Bush tax cuts until the economy is in better shape. Those who advocate letting them lapse are in effect operating on our economic body without benefit of anesthesia. If they are wrong, the consequences will be most severe.

We need to think through any tax increase very thoroughly.

John Mauldin

ߧ

Normxxx    
______________

The contents of any third-party letters/reports above do not necessarily reflect the opinions or viewpoint of normxxx. They are provided for informational/educational purposes only.

The content of any message or post by normxxx anywhere on this site is not to be construed as constituting market or investment advice. Such is intended for educational purposes only. Individuals should always consult with their own advisors for specific investment advice.

A Bubble In Rate Resets, Another In Foreclosures

¹²A Bubble In Rate Resets, Another In Foreclosures

By Steven J. Williams, CyclePro | May 2010

The next 2 charts show the residential mortgage rate reset and recast schedule. The top chart is the combination of all mortgage loan types. The gray bars in the background are what the forward reset schedule looked like as of last September. The blue bars are what the schedule looks like now. The bottom chart is the combined Alt-A and Option ARM loans.


Click Here, or on the image, to see a larger, undistorted image.


Click Here, or on the image, to see a larger, undistorted image.


What I find quite incredible is that the loan modification program has done nothing to change the outlook of defaults caused by rates resetting higher. All it has done is push the damage out somewhat further, to another timeframe. The new reset peak has moved out by several months to around December, 2011. The 'reset' bubble really does not end until about September, 2012. If the normal foreclosure process takes about 6 months, then expect the foreclosure bubble to push out to at least Q1'2013.

The Alt-A, Option ARM chart shows that the value height of these loan types have reduced slightly, but their reset schedules were pushed further out. The combination chart shows that the value of all loans has actually increased. The area under the bars adds up to $1.13T which is an increase of $261B versus the same timeframe from the 2009 report.

We had been told that hundreds of thousands of residential mortgage had been 'renegotiated' to terms that help keep the home buyer in their home. But what these charts are telling me is that that effort has been little more than smoke and mirrors. The likely damage caused by reset-induced defaults has not only been pushed further out in time, the size of that bubble has grown larger.

The most vulnerable of mortgage types are the Alt-A and Option ARM's. The area under the bars for the 3 years charted represents $435B for these two loan types. My biggest mortgage fear is that this reset bubble will continue to be pushed further and further out. So any forecasting we try to do from these charts is likely to shift as well. The reason I fear this scenario is because at some point this bubble must burst. And when it does, it could cause vastly more damage than if it were eased out now.