By Rolfe Winkler, CFA | 11 June 2009
So much for de-leveraging.
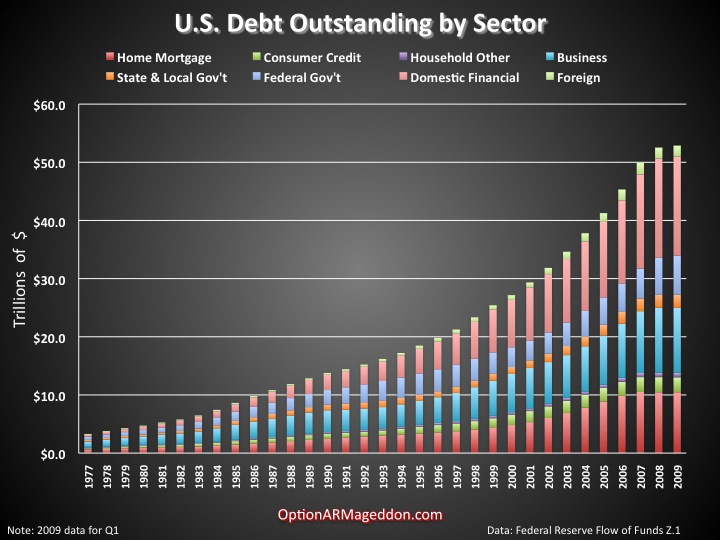
The Fed published its latest Flow of Funds report Thursday. One key takeaway: While total debt is growing more slowly, it is still growing. Since Q3 ‘08 households have cut their debt (slightly), but the federal government is borrowing so rapidly, overall debt continues to expand.
Click Here, or on the image, to see a larger, undistorted image.
By the way, the Fed only includes publicly held debt when calculating total federal government borrowings, $6.7 trillion at the end of Q1. This excludes over $4 trillion owed to the Social Security "trust fund". More importantly, it excludes $60 trillion of unfunded future liabilities for Medicare and Social Security. (see the debt clock above)
Click Here, or on the image, to see a larger, undistorted image.
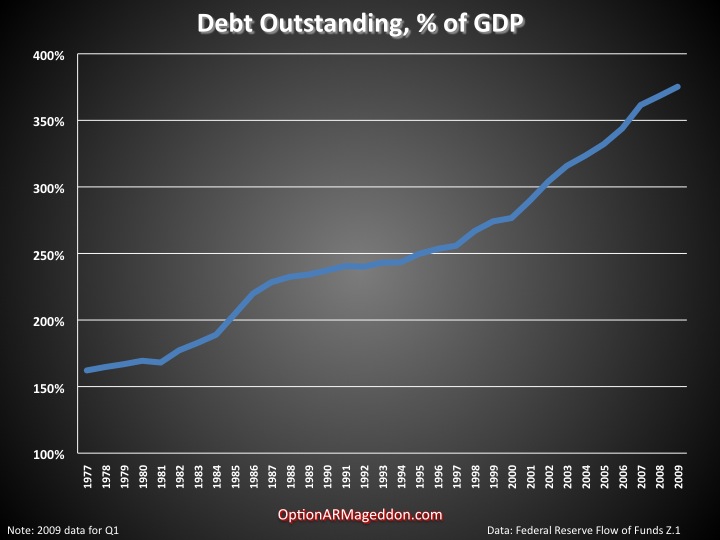
The second chart (above) puts the data into perspective. As a percentage of GDP, debt continues to expand, from 368% at the end of Q4 to 375% at the end of Q1. It’s been said that the income statement is the past, but the balance sheet is the future. Our balance sheet is getting worse. Those who see "green shoots" believe the crisis is abating. But they don’t understand its origin: a credit bubble that, in the aggregate, continues to inflate. [[Even during a severe recession! : normxxx]]The equity value of our economy is going down— think the stock market and housing equity (see below). At the same time our debt is going up. In other words, America’s leverage continues to expand.
The only way to climb out of a debt-induced depression is to pay down debt or to write it off. Levering up only delays the inevitable. Unfortunately Americans, and lately the Obama administration, have shown absolutely no political will to try either remedy. Republicans decry growing deficits, but do you ever hear them enumerate the cuts they would make? Clearly our plan is to keep borrowing until our lenders cut us off.
Speaking Of Crashing Equity
Click Here, or on the image, to see a larger, undistorted image.
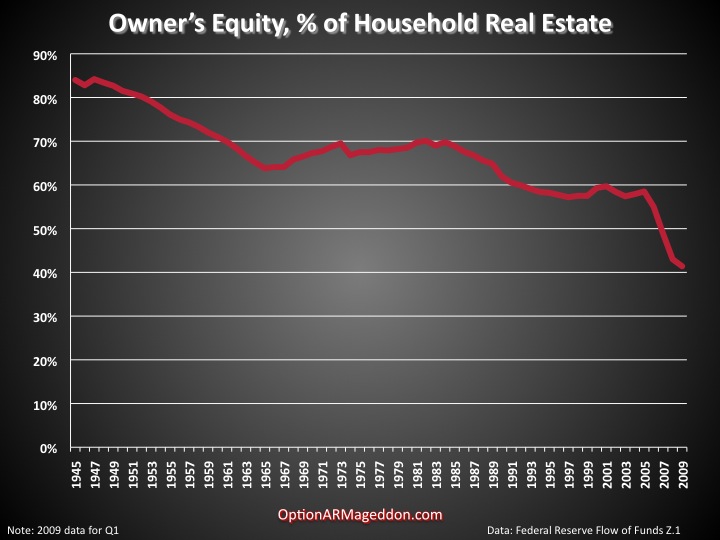
This last chart (above) plots the amount of equity Americans have in their homes. This figure has been crashing as house prices fall while mortgage debt stays roughly constant. At the end of 2007 the figure was 49%, at the end of last year 43%. It now stands at 41.4%. And as CR notes: "approximately 31% of households do not have a mortgage. So the 50+ million households with mortgages have far less than 41.4% equity". [[It's even worse. Figure at least another 19% have very large equity in their homes— they have been diligently paying off their mortgage and are about to retire (or have retired). So, about 50% of the mortgages out there account for about 80% - 90% of the mortage debt. And those mortgagers probably average less than 30% equity in their homes. Want to wager what happens when a goodly portion of them just "walk away from those underwater homes"? : normxxx]]
No comments:
Post a Comment