¹²
Graham’s P/E10 RatioBy
greenbackd | 10 April 2010The wonderful DShort.com blog has a post, Is the stock market cheap?, examining the S&P500 using Benjamin Graham's P/E10 ratio. Doug Short describes the raison d'être of the Graham P/E10 ratio thus:
- Legendary economist and value investor Benjamin Graham noticed the same bizarre P/E behavior during the Roaring Twenties and subsequent market crash. Graham collaborated with David Dodd to devise a more accurate way to calculate the market's value, which they discussed in their 1934 classic book, Security Analysis. They attributed the illogical P/E ratios to temporary and sometimes extreme fluctuations in the business cycle. Their solution was to divide the price by the 10-year average of earnings, which we'll call the P/E10. In recent years, Yale professor Robert Shiller, the author of Irrational Exuberance, has reintroduced the P/E10 to a wider audience of investors. … The historic P/E10 average is 16.3.
|
Here's the chart from DShort.com to April 1st: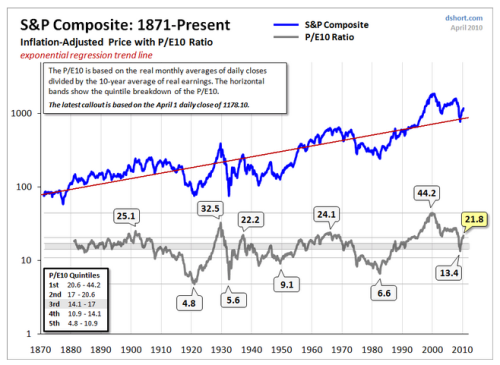
Click Here, or on the image, to see a larger, undistorted image.So what is the P/E10 ratio now saying about the market? In short, the market is expensive. The ratio has entered the most expensive quintile, which means it is more expensive than it has been
80% of the time. What are the implications for this?
In his most recent Popular Delusions (via Zero Hedge), Dylan Grice has provided the following chart setting out the expected returns using each valuation quintile as an entry point:Grice says: - If history is any guide, those investing today can expect a whopping 1.7% annualised return over the next ten years.
|
Doug Short has a more frightening conclusion: - A more cautionary observation is that every time the P/E10 has fallen from the first to the fourth quintile, it has ultimately declined to the fifth quintile and bottomed in single digits. Based on the latest 10-year earnings average, to reach a P/E10 in the high single digits would require an S&P 500 price decline below 540. Of course, a happier alternative would be for corporate earnings to make a strong and prolonged surge. When might we see the P/E10 bottom? These secular declines have ranged in length from over 19 years to as few as three. The current decline is now in its tenth year.
Or was March 2009 the beginning of a secular bull market? Perhaps, but the history of market valuations doesn't encourage optimism.
|

Click Here, or on the image, to see a larger, undistorted image.ߧ
Normxxx ______________
The contents of any third-party letters/reports above do not necessarily reflect the opinions or viewpoint of normxxx. They are provided for informational/educational purposes only.
The content of any message or post by normxxx anywhere on this site is not to be construed as constituting market or investment advice. Such is intended for educational purposes only. Individuals should always consult with their own advisors for specific investment advice.


No comments:
Post a Comment