Click here for a link to complete article:
By John P. Hussman, Ph.D. | 15 April 2008
All rights reserved and actively enforced.
Over the past week, there has been increasing talk that the current mortgage troubles are "closer to the end than the beginning," are "in the 7th or 8th inning," and so on. Along with those comments, some from heads of financial companies such as Morgan Stanley, are assertions that there is "a lot of cash on the sidelines" to support the markets.
It would be nice to believe these assurances. But as I noted in my October 15, 2007 market comment (Warning— Examine All Risk Exposures):
|
Balances in money market funds are also not "cash on the sidelines." Securities are simply evidence that money has been intermediated from a saver to a borrower. Once the security is issued, it exists until it matures or is otherwise retired. If I have $1000 "on the sidelines" in Treasury bills, it represents money that has already been spent by the Federal government. If I sell this T-bill to buy stocks, somebody else has to buy it, and there will be exactly the same amount of money "on the sidelines" after I buy my stocks than before I bought them. It is simply a fallacy of non-equilibrium thinking to imagine that money "goes into" or "comes out of" secondary markets in securities.
The Impact Of Foreign Inflows
As for the primary markets, where financial companies are issuing some amount of new equity and debt to improve their liquidity, yes, these funds predominantly represent new savings. Unfortunately, U.S. savers are not (in equilibrium) the source of these savings. Instead, we are drawing on foreign savings by expanding our current account deficit. This is precisely why the trade figures worsened last month, despite a weakening economy. To understand that, it's important to recognize that for every $100 of "stuff" we import from foreign countries, we export exactly $100 of "stuff" in return. The issue is only whether the stuff is goods and services, or securities.
For example, suppose we import $100 of goods and services, but we only export $70 of goods and services to foreign countries in return. Clearly, we've got $30 of extra stuff that we'll need to export to pay the difference, and that $30 will be in the form of U.S. government or corporate securities. In this case, we have a $30 "trade deficit" (the shortfall between our import of goods and services, and our export of goods and services), which is financed by a $30 "capital surplus" (our net transfer of securities— and import of foreign savings— from other countries).
Generally speaking, the trade deficit shrinks substantially during recessions, as U.S. investment in factories, equipment and housing falls, and with it, the need to sell securities to foreigners. So in the example above, our imports might stay at $100, but as we have less need of foreign savings to finance our investment, we might only export $20 of securities. Meanwhile, as the dollar weakens in a recession, we would then export $80 of goods and services to foreign countries. While the actual change in the trade deficit and current account depend on a variety of factors, including the value of the dollar, the level of interest rates, the demand for U.S. securities, and the preferences of consumers for imports and exports, we know as an accounting identity that every $100 of "stuff" we import will be matched by $100 of stuff that we export.
In recent months, we should have seen the trade deficit improve due to a weaker U.S. economy. But the liquidity needs of financial companies have forestalled this, requiring us to draw further on an already huge current account deficit.
Increasingly, we are selling off pieces of our economic future to foreigners (some analysts even talk about "sovereign wealth funds" as if we should be excited about this). Unfortunately, we are forced to do this because our own savings are not sufficient to finance our own domestic investment. The reason for this is largely due to war spending and lopsided tax policy. As an economics professor, I used to teach my students about production frontiers— choosing how to allocate resources between guns and butter— machine guns versus tubs of Land O'Lakes. We are ensconced in a very real version of that, and we should not look at rapid issuance of government debt, heavy foreign acquisition of our assets, and widening current account deficits with stars in our eyes that somehow our growing mountain of indebtedness is something good.
Which "Inning" Of The Mortgage Crisis Are We In?
One of the fascinating aspects of Wall Street is the ability of analysts to provide opinions without the faintest backing from evidence. Among the latest topics of opinion is how far the mortgage crisis has to go. Evidently, the idea is that the recession that these analysts didn't forecast is already over, so it is time to "look across the valley" on the belief that most of the writedowns are behind us. A good way to estimate where we are in the process of writedowns and foreclosures is to revisit the schedule of resets for adjustable rate mortgages.
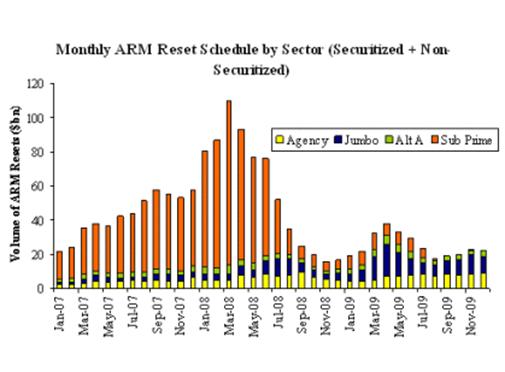
Source: Bank of America
The chart doesn't extend out to 2010, where another spike in resets will occur in the third quarter of that year, but it is enough to recognize that resets are only now entering the heavy period. To understand the implications of this schedule, it is important to recognize the foreclosure timeline. Once a reset occurs, it takes up to 30 days for the first payment to be missed. After 90 days of attempts to catch up on missed payments, the homeowner is served with a "Notice of Default." It then takes another 90 days with the homeowner in default for a "Notice of Trustee Sale" to be delivered, shortly after which the property is sold in a foreclosure. In short, there is generally a span of about 6 months from reset to foreclosure, which means that we have to lag the data to get the profile of anticipated loan losses.
Fortunately, only a portion of the mortgages that reset will actually go into default, but we estimate which "inning" we are currently in by calculating the cumulative amount of mortgages that will have reset at each point in time (i.e. integrating the curve), and lagging it by 6 months (roughly the span between reset and foreclosure). That produces the following profile for the cumulative losses that can be expected. Again, these are not dollar amounts, since only a portion of even sub-prime mortgages will default. While we will also undoubtedly observe losses from credit cards, commerical real estate, and home equity loans, the point here is only about the general shape of the cumulative loss curve:
Clearly, as we enter April 2008, we appear to be quite early in the mortgage crisis, with only about a quarter of the cumulative resets having occurred. That places us near the start of the third inning, where we can expect each of the nine "innings" to be about three months in duration. Unfortunately, the next three innings (quarters) are when the heavy hitters on the opposing team will come up to the plate, as the cumulative amount of resets will surge. With that surge, loan losses and foreclosures will also predictably spike higher.
Moreover, because of the bundling, securitization*, and slicing and dicing of mortgage obligations, financial companies have little ability to take the required writedowns in advance, because they don't know yet which ones will go into default. To opine that we are in some late "inning" of the mortgage problem, without reference to the reset data, is just naïve. If anything, the probable rate of foreclosure on later resets will be higher, not lower, than the earlier resets, because those later resets represent the mortgages initiated at the peak of home prices and the trough of lending standards.
Market Climate
As of last week, the Market Climate for stocks remained characterized by unfavorable valuations and still unfavorable market action. As always, our measures of market action are based on a broad range of market internals, including factors such as breadth, leadership, industry group dispersion, credit spreads, interest rate behavior, and so forth, as well as more specialized measures of price/volume behavior and other market-generated information.
Our underlying view is that market action carries information content— particularly in the divergence between actual price movements and their conditional expectation (that is, what we would expect, given the behavior of other securities and economic factors). We don't believe that market action carries information perfectly (which is essentially what the efficient market hypothesis assumes), but we do believe that market action contains information about a) expectations of investors about future economic outcomes, and b) the attraction or aversion of investors toward speculation and risk.
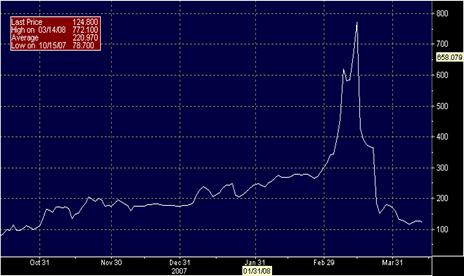
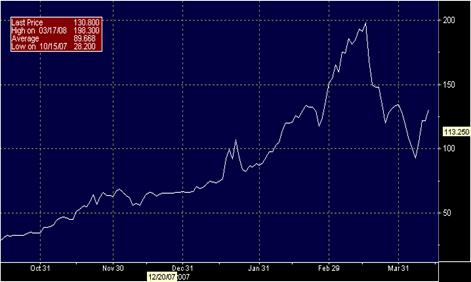
Below, for example, is a chart of Bear Stearns' 5-year credit default swap spread. You'll notice that this puppy was barking enough to wake the neighbors weeks before the crisis reached the point of no return, and the Fed intervened to facilitate J.P. Morgan's takeover. This is a good example of market action conveying information, and is why we've frequently emphasized the importance of credit spreads in measuring economic risks.
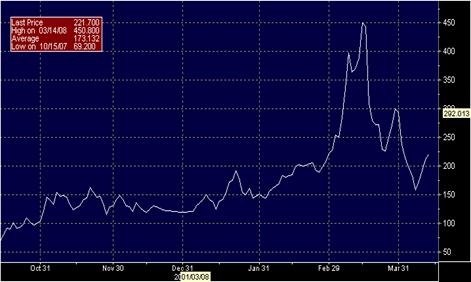
Though credit default spreads for financial companies have narrowed since the peak of the Bear Stearns crisis, it's notable that they promptly reversed higher last week. Below are the CDS spreads for Lehman and GE Capital Corporation (emphatically not chosen because there is any reason to single them out— the behavior of CDS swaps looks like this almost across the board).
Importantly, our evaluation of market action will frequently differ from the views of many technical analysts, both because we use our own set of measures, and because we are not concerned with evaluating obvious (ex-post) short-term trends in the major indices. They are exactly that— obvious— and if you spend any amount of time testing strategies based on obvious trends, you'll find that they rarely produce much in the way of long-term returns. Moreover, we're simply not in the business of calling tops, bottoms, or reversals. We do carefully manage risk, but our analysis is focused on identifying the prevailing Market Climate on the basis of existing valuations and measurable market action, and then aligning our exposure to risk in proportion to the average return/risk profile that a given Climate has historically produced. With the rare exception of overbought conditions in an unfavorable Market Climate (as we had last week), or oversold conditions in a favorable Market Climate, I typically have no views regarding the short-term market outlook.
Presently, the Strategic Growth Fund remains fully hedged, with a "staggered strike" configuration to our hedge which strengthens our defense against market weakness. The S&P 500 Index is down about 15% from its 10/11/07 high, while the Strategic Growth Fund has gained slightly. Though we have correctly avoided financial stocks, we have not had significant weight in the "hot" materials sector. Meanwhile, at least early into January, the consumer and technology areas where we do have significant exposure were hurt as much as the general market. Since its January 11 trough, Strategic Growth has achieved positive returns while the S&P 500 has declined over 4% further, but it may take time for investors to separate the wheat from the chaff in a way that would produce material differences in the performance of our stocks relative to the major indices. The same was true during the 2000-2003 decline, when the bear market was in full force for several months before the Strategic Growth Fund achieved much in the way of gains.
Our primary objective remains to outperform the S&P 500 over the full market cycle, with smaller periodic losses. Our immediate objective is to constantly tilt the Fund's portfolio toward stocks that appear to have some combination of strong valuations and favorable market action, and hedge that portfolio well enough to be able to sleep nights. I believe that investment returns tend to follow discipline and daily action— while we can't force the returns, we can certainly pursue our discipline consistently. Meanwhile, we are comfortably hedged, and while we will respond to improved conditions if they emerge, I presently expect that the market's difficulties aren't over.
In bonds, the Market Climate last week was characterized by unfavorable yield levels and relatively neutral yield pressures. Inflation pressures remain persistent, particularly on the import price front, while at the same time a fresh widening of credit spreads suggests further economic trouble ahead. Overall, I continue to see little merit in long-term bond exposure except for purely speculative "flight to quality" considerations. The Strategic Total Return Fund remains invested largely in Treasury bills here, which is unusual but at present, necessary in my view. The Fund also holds just over 15% of assets in precious metals shares— not an aggressive stance, but still constructive based on continued favorable conditions overall in the precious metals area.
——
*The Wall Street Journal has a nice set of graphics that describe how mortgage securitization works.
With Regard To The Wisdom Of Taking Too Much Comfort From Assurances Of Wall Street CEOs, Michael Lewis recently had this commentary in Bloomberg: What Wall Street's CEOs Don't Know Can Kill You.
——
Prospectuses for the Hussman Strategic Growth Fund and the Hussman Strategic Total Return Fund, as well as Fund reports and other information, are available by clicking "The Funds" menu button from any page of the linked website.
M O R E. . .
Normxxx
______________
The contents of any third-party letters/reports above do not necessarily reflect the opinions or viewpoint of normxxx. They are provided for informational/educational purposes only.
The content of any message or post by normxxx anywhere on this site is not to be construed as constituting market or investment advice. Such is intended for educational purposes only. Individuals should always consult with their own advisors for specific investment advice.
No comments:
Post a Comment