By Moses Kim | 2 September 2009
Assets are continually revalued against one another in an ongoing process to determine proper valuations. Investor preferences move in big waves, from paper assets to hard assets. The decades of the 80's and 90's were clearly periods when paper assets such as stocks, bonds, and derivatives performed exceptionally well. That era of paper wealth is gone for now, as evidenced by the mass failure of financial institutions last fall, and we have entered into a period when hard assets are in vogue.
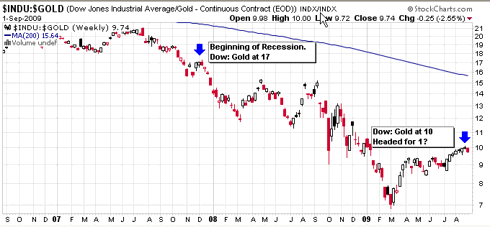
The Dow to Gold ratio is a useful tool to track this process of asset reallocation, since gold is the ultimate hard asset. Usually, when hard assets enter into a bull market, the Dow to Gold ratio goes to under 5. For example, the ratio hit 1 in 1896, 2 in 1932, 3 in 1974, and 1 again in 1980. The current bull market in gold has brought the ratio from a high of 44 in 1999, to its current reading of 10. [[On the other hand, it was as low as 7 on March 6 of this year.: normxxx]]
In addition, there seems to be a tendency for the ratio to "overshoot" on the downside based on how overextended the ratio becomes. For example, an 18 Dow:Gold ratio eventually fell to 2 in 1932, and a 27 Dow:Gold ratio eventually fell to 1 in 1980. Considering that the Dow:Gold ratio was at 44 prior to this move, it looks like we may yet have a ways to go on the downside.

The decade-long move in gold may seem overextended, but there are still several bullish factors working in gold's favor. First, gold has been able to trade above 900 since the supposed recovery in the economy and massive rally in stocks beginning in March. A similar consolidation pattern in gold in 2006 preceded a 50% surge in prices. Anyone familiar with fractals is eying this pattern and its potential completion.
Second, gold has been able to rise along with the dollar index, which is usually a bullish signal. Third, we are moving into a historically bullish season for gold. [[Gold tends to be very seasonally strong in September.: normxxx]] With stocks overpriced at around 129 times reported earnings, a decent-sized pullback is in order. [[While earnings can be expected to increase sharply in Q3, especially for the banks (whose 'smoke and mirrors' accounting is being aided and abettted by the Fed and the GAAP), it is hardly likely to bring that P/E ratio back down to normal— around the mid teens.: normxxx]] Therefore, I expect the Dow to Gold ratio to decrease in the coming months and years. Keep an eye on the Dow to Gold ratio as an indicator of the "smart" investor sentiment and relative valuation of asset classes.

Click Here, or on the image, to see a larger, undistorted image.

Click Here, or on the image, to see a larger, undistorted image.
For more info, see Fred's Intelligent Bear Site
To quote from that source:
|
For a completely alternative view, see:
How the World's Best Investors See the Market
By Porter Stansberry, Thursday, September 17, 2009
No comments:
Post a Comment