|
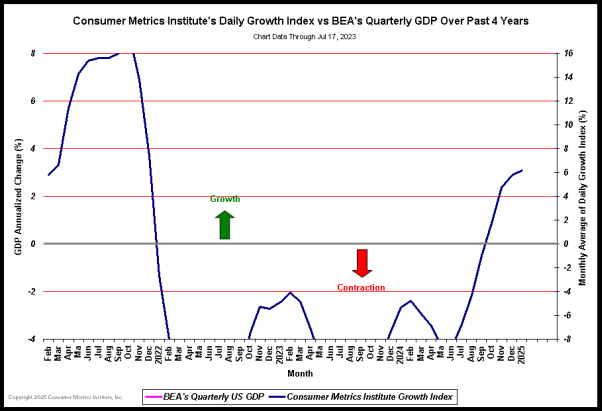
Growth Index Past 4 Years(1):
Click Here, or on the image, to see a larger, undistorted image.
Notes:
(1) The Consumer Metrics Institute's 91-day 'Trailing Quarter' Growth Index -vs— U.S. Department of Commerce's Quarterly GDP Growth Rates over past 4 years. The quarterly GDP growth rates are shown as 3-month plateaus in the graph. The Consumer Metrics Institute's Growth Index is plotted as a monthly average. Please see our Frequently Asked Questions page for a more complete description of our Growth Index.
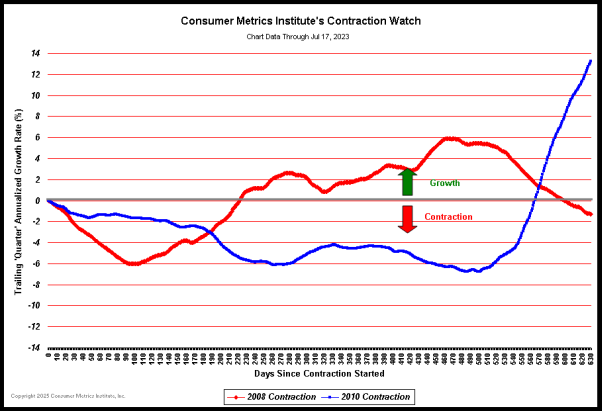
Consumer Metrics Institute's Contraction Watch(2):
Click Here, or on the image, to see a larger, undistorted image.
Notes:
(2) The comparison of the 91-Day Growth Indexes during the 'quarter' immediately following the commencement of a contraction. The quarterly GDP growth rates are shown as 3-month plateaus in the graph. The Consumer Metrics Institute's Growth Index is plotted as a monthly average. The contraction events of 2006, 2008 and 2010 are shown against the same scale of annualized contraction.
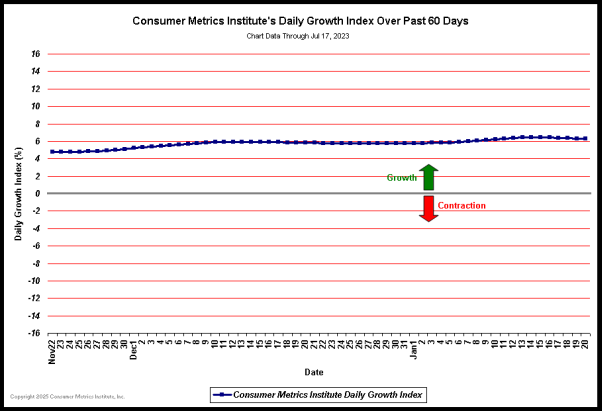
July 26, 2010— Daily Growth Index Surpasses 3% Contraction Rate:
Since last week our Daily Growth Index has weakened further, surpassing a year-over-year contraction rate of 3%. This daily measurement of on-line consumer demand for discretionary durable goods has now dropped to the lowest level it has recorded since late November 2008:
Click Here, or on the image, to see a larger, undistorted image.
Our Daily Growth Index reflects the strength of consumer demand over the trailing 91-day 'quarter', weighted according to the contribution that goods involved in on-line transactions make to the GDP (per the BEA's NIPA tables). It is designed to serve as a proxy for a 'real-time' GDP, and it slipped into net contraction on January 15th, 2010. To put this decline in perspective we offer the following observations:
 The current contraction in consumer demand for discretionary durable goods has now extended for more than 6 months. The day to day level of the year-over-year contraction is now worse than a similar reading of the 'Great Recession' of 2008 was after 6 months.
Click Here, or on the image, to see a larger, undistorted image.
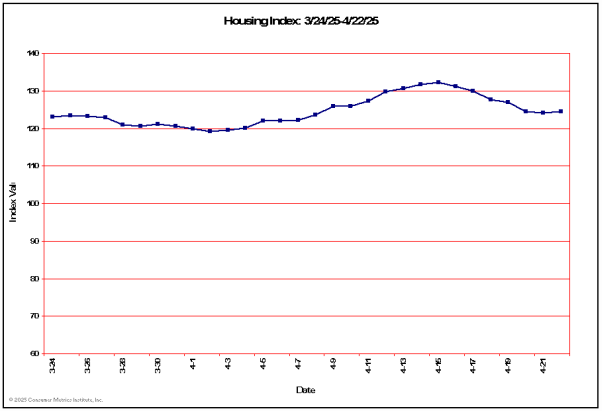
The amount of damage done to an economy by an economic slowdown can be quantified by multiplying the event's average rate of contraction times the duration of the event. By that measure the 2010 contraction has now inflicted 43% as much pain on the economy during its first 6 months as the 'Great Recession' did during the first 6 months of that slowdown. Although this contraction has not yet reached the extreme contraction rates that were seen during 2008, after 6 months it has not yet formed a bottom. Furthermore, it is now likely to last longer than the 2008 event. In an even broader perspective, the current level of the Daily Growth Index over the trailing 91-day 'quarter' would put it among the lowest 6% of all calendar quarters of GDP growth since 1947. Only roughly 1 in 17 quarters of GDP activity have been worse. The duration of the current contraction event is becoming a real problem. Our trailing 183-day 'two consecutive quarters' growth index has dropped into the 5th percentile among similar two consecutive quarters of GDP 'growth' since 1947. This means that the trailing 6 months have been statistically worse than the trailing 3 months— less than one in twenty 6-month spans have been worse since the BEA began keeping quarterly records.Our Housing Sector Index has been volatile recently, swinging as much as 10% in less than two weeks. These kinds of swings have also shown up in media reports on home sales:
Click Here, or on the image, to see a larger, undistorted image.
A substantial portion of that volatility has been the result of recently renewed interest in the refinancing of existing owner occupied residential mortgages:
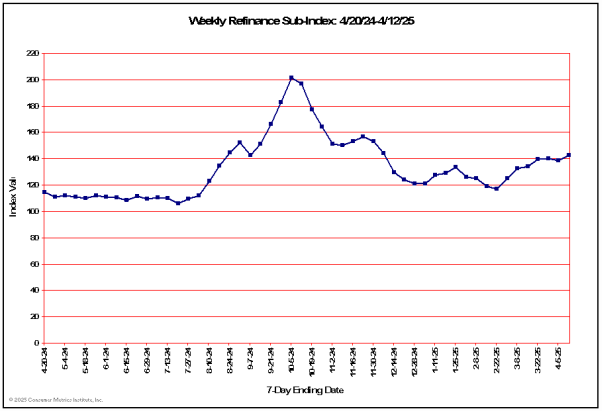
Click Here, or on the image, to see a larger, undistorted image.
When that upturn in recent refinancing activity is compared to a similar chart for consumer interest in loans for the initial purchase of new or existing residences, a clear divergence can be seen:
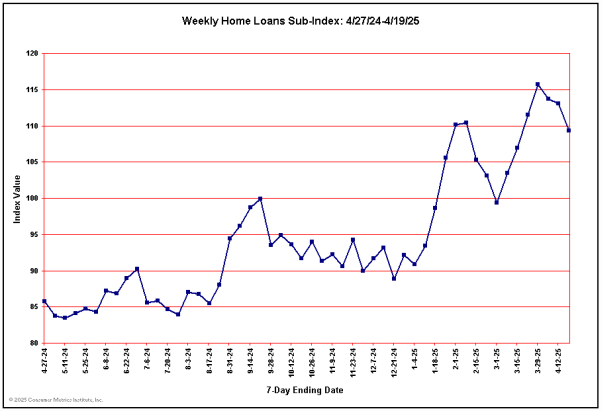
Click Here, or on the image, to see a larger, undistorted image.
Although our Housing Index reacts on a day to day basis to both types of loan activities, it is probable that in the current economic environment they are making very different contributions to economic growth. That wasn't true as little as three years ago, when refinancing activities were an economic engine of growth, cashing out homeowner equity and reinvesting it in home improvements or other durable goods.
In contrast, today's refinancing activities are much less likely to result in increased leverage and surplus cash. In fact, much of the refinancing activity may be resulting in deleveraged loans and 'cash-ins' to maintain conforming LTV ratios. All of this activity may simply be the result of homeowners seeking to lock in historically low mortgage rates, while deploying available cash into long term 'investments' with relatively high yield-to-risk ratios. In any event, we would read any upward volatility in our Housing Index with caution until consumer demand for initial purchase home loans significantly improves.
At the Consumer Metrics Institute we measure day-by-day changes in the discretionary durable goods transactions of internet shopping consumers. We genuinely believe that the real economy lives where 'Main Street' consumers are (figuratively and/or literally) clicking 'Add to Shopping Cart', not where the GDP's factories slavishly follow the consumer's lead. The millions of consumers we measure each day respond collectively to what they see going on in their own local economy, with their own family and with their own friends. And right now, real-world 'Main Street' consumers are demonstrating substantial caution.
Note: A more complete list of historical Commentary can be found on our History Page
No comments:
Post a Comment