Nationwide Economic And Housing Data Points To Challenges Ahead; A Difficult Second Half Of 2010.
By Dr. Housing Bubble | 2 July 2010
The economy enters the second half of 2010 on shaky ground. The stock market had a poor performing quarter reflecting the bad days of 2008. The large amount of troubled loans out in the market is rising to the surface in a non-uniform way. While banks try to re-work loans with government gadgetry and at the full expense of taxpayers, most of the public that operates in the real economy where the economy never really recovered understands that things are far from any recovery.
I normally listen to a few financial shows on my iPod but for the last month, took a hiatus from some of the financial media. As I put on my earphones and listened to shows from early to mid-June, I realize how utterly wrong "analysts" are in predicting trends. In fact, one show was aired when the DOW was up over 10,500 and they were talking how at the end of the month, only a few days away, we would end at 11,000. We ended the month at 9,774. Many in the financial mainstream press are like the shamans trying to heal illness with ritualistic dances. In this case, the dance involves singing the praises of housing and the inevitable bull market run that is "just around the corner".
Chart 1— New Home Sales
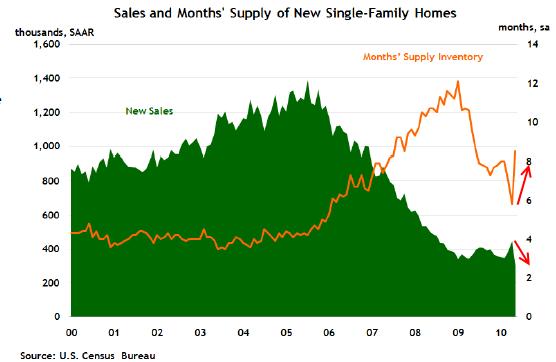
This first chart shows the collapse in new home sales. Why should we be concerned with the above? New homes usually sell for a higher price but also create demand for jobs in construction. With the market falling due to lack of demand (aka, people dealing with a poor economy) there is little need for new home construction. Much of the demand was pulled forward with every imaginable gimmick that the government could muster.
The U.S. Treasury and Federal Reserve have conjured up many magical ways to get people to buy— but there is only so much that can be done in the longer term. The drop in new home sales shows us that the second half is going to be a major challenge especially for housing. Keep in mind that spring and summer are the high selling seasons. We have roughly two months left for 'spectacular' results before entering the weaker fall and winter.
When I talk with colleagues about a double dip we usually have to reflect on where things improved. Sure, the 401k looks better than early 2009 but most don't understand why. They just assume that since the government juiced up Wall Street that somehow this will take care of itself. Of course, much [[most?: normxxx]] of the aid has been shifted to crony bankers who use the housing industry as a buffer for their own personal enrichment, to the detriment of the rest of us. New home sales tanking is simply reality reasserting itself in a massively subsidized market.
Chart 2— Employment by Sector
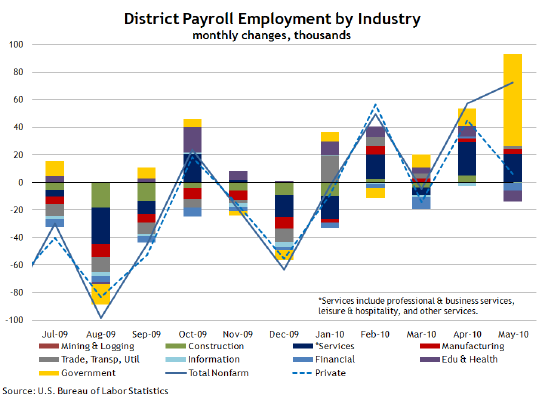
Click Here, or on the image, to see a larger, undistorted image.
Government has been the sole big sector out there hiring. Much of the growth in the last few months has come from temporary hiring by the Census. As this retreats the private sector will need to pick up the slack but it doesn't look like it can do it. Some economist point to 1990 and 2000 with similar trends, but 2010 is nothing close to those decades.
During those times, we weren't dealing with an epic global housing bubble. We also didn't have a stock market reacting like the market during the Great Depression. Right now the government is the housing market, employment market, and best friend to Wall Street.
The ADP report this week showed tepid hiring in the private sector. This Friday we are expecting a job loss figure but the real data will be on how many jobs are added (or lost) in the private sector. The trend of artificial stimulus is simply unsustainable.
Chart 3— Deficit
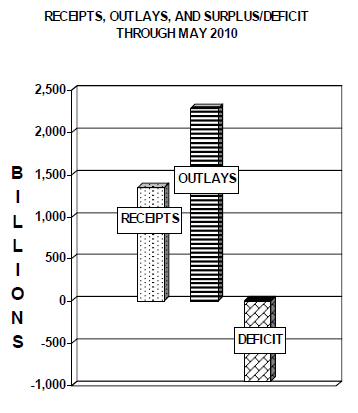 It cost money to do all that we are doing. This chart looks like the balance sheet of many households. A household with a budget like that will be at risk of foreclosure and bankruptcy.
 Yet for our government, we are supposed to believe that this is somehow good. In May, we collected $146 billion in receipts. At the same time we spent $282 billion. For the current fiscal year we have a $935 billion deficit. What are we spending this money on?
It would be one thing if we were spending these hundreds of billions in actually creating jobs and industry to put people back to work. At least that I can stomach. But we are using money for delusional tax breaks so people can buy homes they can't afford and using the Federal Reserve as the Fort Knox of buying up mortgage backed securities. There is something disturbing about the massive wealth transfer that is occurring in our country.
If the funds were actually going towards putting people back to work it would be more palatable for the public— but when all of it is going to backstop this real life Wall Street monopoly game, people start realizing something is seriously off. If someone is going to defend deficit spending, they should at least argue that there can be no deficit spending without actually reforming the financial system first. Otherwise, you simply spend more with the bulk going to financial firms [[and the 'fat cats' working there: normxxx]], with a few crumbs that fall off the plate going to the economy. It is taxpayer money that is keeping the system afloat yet they are being helped the least.
Chart 4— Existing Home Sales
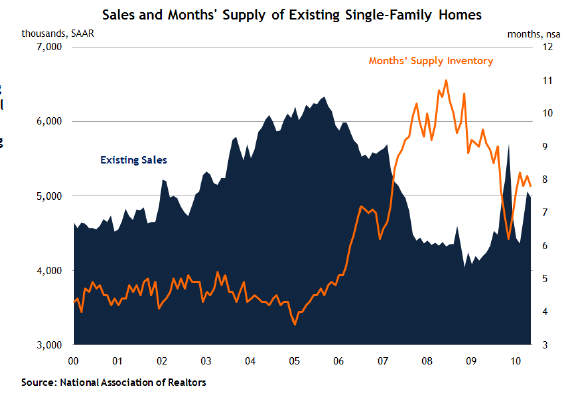
Existing home sales are a large reason why new home sales have collapsed. Why pay that much more when there are tens of thousands of foreclosures to be had at much lower prices? But even here, we are seeing demand wane as the tax credit euphoria begins to wear off. This shows us that nationwide housing is in for a challenging second half.
Sure, the government can talk about extending tax credits and other gimmicks but part of the surge was the notion that "this was it" and people had to buy now to take advantage of these offers. If we are going to have tax credits into perpetuity the market will simply adjust. If people start seeing that home prices can move sideways and even fall going forward, why would they jump in?
You also need good income with a steady job to buy a home. Those hundreds of thousands of Census jobs were merely temporary. They can't buy homes. Who will? Clearly the answer is not many, once the air is let out of the balloon. Going forward we need to have the economy and jobs stabilize before seeing any housing recovery.
Chart 5— Home Prices
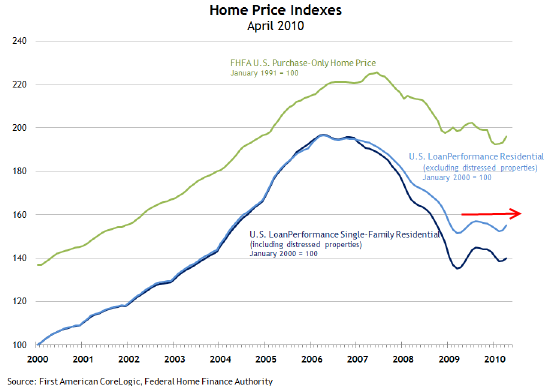
Home prices have moved sideways even with all the government intervention. With some of this starting to wear off, we are likely to see either of two possible scenarios in the second half. One is a continuation of the sideways trend. In other words, prices don't move up or down. The more likely case is prices move lower to reflect the demand pulled forward.
Should interest rates rise, this would be another reason to push prices lower. Of course rates won't go up dramatically because of the Fed, but market forces can change dynamics quickly as we have seen in Ireland, Greece, and now Spain. Certain areas of California are still clearly in housing bubbles.
There is much to be cautious about in the second half. As I finished listening to the financial Podcasts from a few days ago, it is obvious that the so-called experts have no idea where we are heading. They merely react to the day to day movements in the market and don't take a larger macro approach. The above data combined with massive amounts of shadow inventory and weak hiring tells us the economy needs to brace itself during the second half. Can't call it a double dip if most Americans are still in the trench.
***********************************************************
800,000 mortgages in California are 30+ days late or in foreclosure. Only 132,000 show up in the MLS. Why there will be no housing bottom for California until at least 2012.
The latest data on new and existing home sales shows us evidence that housing has benefited from a bear market bounce but that has now come to an end. The drop in existing home sales was sizable but the drop in new home sales came in at a record breaking figure. The difference here comes from the large amount of distress inventory still moving at lower prices. The amount of troubled mortgages still filtering through the system is large and gives us pause for caution.
Much of the boost can be said to have come from the massive government intervention. In California there is now money going to banks to match a principal reduction for those homeowners in distress. In other words, the focus is on the problems and not establishing a more stable market for housing. Over the last year, we also saw many people moving off the sidelines spurred by low interest rates, tax credits, and the perception that housing had hit bottom. For California, the data signifies that there will not be a bottom until at least 2012 and that is what we will examine in this article.
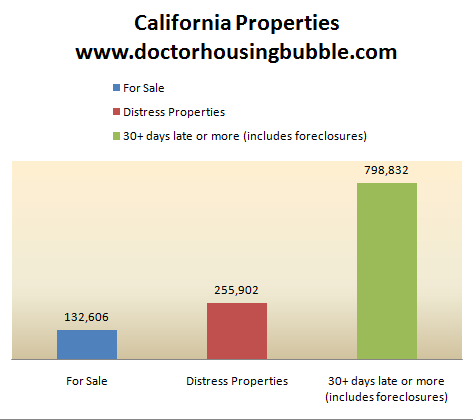
Let us go through each category above to make things clearer. The for sale column is pulling data from the MLS. This is data that the public can view either through a realtor or through one of the many sites available online. The next column for distress properties includes all notice of defaults, properties scheduled for auction, and those that are in foreclosure. As you can see from the differences between the "for sale" column to "distress properties" column, a large part of this real estate has yet to make its way into public view.
Finally, we know from banking and current mortgage data that 15 percent of California mortgage holders are at least 30+ days late or are in the process of foreclosure. This is the most troubling data of all. Nearly 800,000 properties show up here. What this tells us is that we have a few years of working through this mess before finding any sign of stability. Keep in mind a large number of troubled mortgages have yet to be dealt with in the state.
The above should give you a sense of what we have today in California; but let us continue the math. Last month statewide, California had 40,965 home sales. At the same time, 24,669 new notice of defaults were filed. So let us do the math here:
40,965 - 24,669 = 16,296 Homes Cleared Out Of The Massive Inventory
Now depending on your perspective, if we only look at MLS data, we have roughly 3 months of inventory in the state. Including the "distress" data, we have over 6 months of inventory. But if we look at the broadest measure of all mortgaged homes in or likely to wind up in foreclosure, we have 19 months of inventory. Moreover, we are using the current sales rate. Keep in mind that this is abnormally high because of tax breaks and (unadjusted) seasonal factors.
We also have to take into account that last month nearly 25,000 more properties were being put into the front end of the pipeline heading for future distress (not counting non-distressed homeowners who want to sell). Subtracting this out, we really cleared only about 16,000 properties for the month.
Even assuming no new foreclosures (not likely), it will be mid to late 2012 at the very earliest before we have any semblance of a bottom in California. Keep in mind that California is also battling a troubled state budget. This will require new revenues (higher taxes) or more cuts (higher unemployment). Both options are bad for housing going forward.
Double Dip Recession
I'm surprised that many in California are talking about a double dip recession. In this state at least, we never got out of the last recession! All we need do is look at the unemployment data to show this:
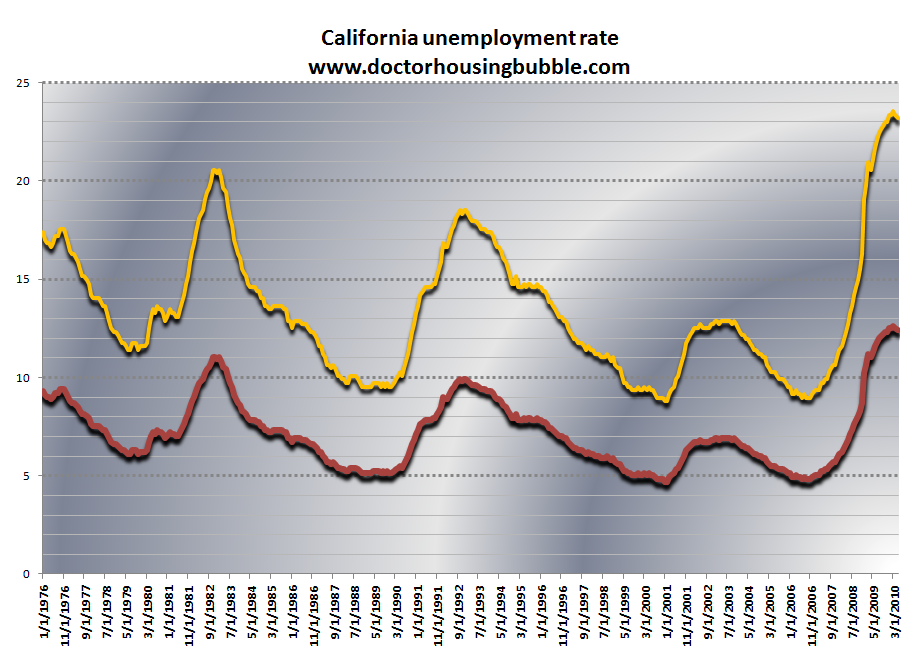
Does that look like we've already seen our first dip? Unemployment is still sky high for the state. Without a solid economy there is little prospect that real estate in California will somehow enter another golden era. We have lost over 1 million jobs in the state since the recession started. Last month we added a net 28,000 workers to the payrolls— at which rate it will take us 35 months before getting back to pre-recession unemployment. And looking at the data carefully, we see that the bulk of employment growth came from the government sector. This provides further evidence that we are still at least two years away from any housing bottom.
Drag Of Shadow Inventory
Looking at the first chart you realize that there is a tremendous amount of distress property on the market that is hidden from the public. This large amount of 'shadow' inventory will be a drag on California real estate prices for years going forward. Nearly 800,000 mortgages in California are at least 30+ days late or are in the process of foreclosure. Yet only 132,000 homes are listed on the MLS.
That is why it is hard for any honest realtor to tell you with a straight face that there is "only" 3 months of inventory— so you need to move fast. Most understand that the real market is full of troubled properties. Plus, you realize that we still have many thousands of homeowners newly falling behind (and already delinquent) on their mortgages— with no end in sight.
We all realize the issues with Alt-A and option ARM products. These are still out there and will not finish resetting/recasting until 2012 (at least for the bulk). But now, the major difficulty revolves around problems in the much larger prime mortgage market. Fannie Mae and Freddie Mac are losing money left and right (which means we as taxpayers are losing money left and right). FHA insured loans are plagued with sharply rising defaults— these make up about 4 out of 10 loans in California and this trend has held for nearly a year.
The massive drag of 'shadow inventory' will keep a firm lid on real estate prices going forward. Add the fact that higher priced property prices have yet to adjust significantly and we have another market that will take a hit (i.e., Culver City, Pasadena, etc.) when they finally do adjust to competitive prices.
2012 Bottom?
Predictions in this market are a losing game, with government intervention creating all kinds of distortions to an orderly correction. Yet prices have fallen. So things simply get dragged out. The data seems to indicate that we will not see a 'bottom' (ie, the peak in total inventory) until 2012 at the earliest.
This doesn't necessarily mean a bottom in prices but merely a time when we will have worked through this massive amount of shadow inventory. There is little reason to buy right now in many cities and renting is a much better option for many. Until we work through these 800,000 properties, California is going to have a highly volatile market. Buyer beware.
ߧ
Normxxx
______________
The contents of any third-party letters/reports above do not necessarily reflect the opinions or viewpoint of normxxx. They are provided for informational/educational purposes only.
The content of any message or post by normxxx anywhere on this site is not to be construed as constituting market or investment advice. Such is intended for educational purposes only. Individuals should always consult with their own advisors for specific investment advice.
No comments:
Post a Comment