By Steve Saville | 31 January 2008
| Below is an extract from a commentary originally posted at www.speculative-investor.com on 24th January 2008. |
As noted in the email we sent to subscribers following Tuesday's (22nd January) dramatic US trading session:
|
We will now take a look at the situations mentioned above with the aid of charts from the excellent Decisionpoint.com web site.
The first chart shows the most recent two occasions when the number of new lows on the NYSE exceeded 1100, including this week's event. Notice that the '1100+ new lows day' in August of last year was followed by a strong 2-month advance to a new all-time high, after which the market embarked on the downward trend that led to this week's selling climax. Last year's dramatic surge in new lows was actually the 'odd man out' in the historical record in that it wasn't followed, within three months, by a successful test of the bottom reached on the day of the selling climax.
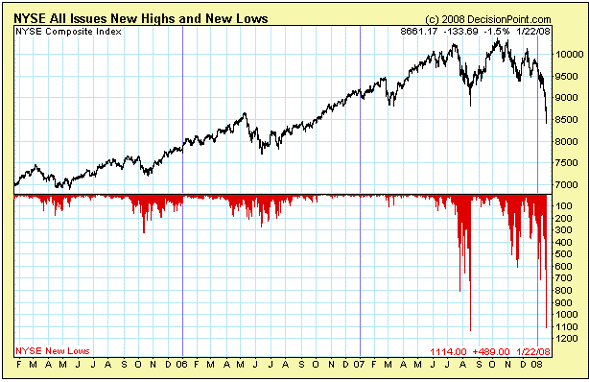
Click Here, or on the image, to see a larger, undistorted image.
The next chart highlights the bottoming process during the 1998 financial crisis. For all intents and purposes the stock market reached its ultimate correction low on 31st August 1998— the day on which the number of new lows was greater than 1100. Notice, though, that the 31st August bottom was tested about 6 weeks later.
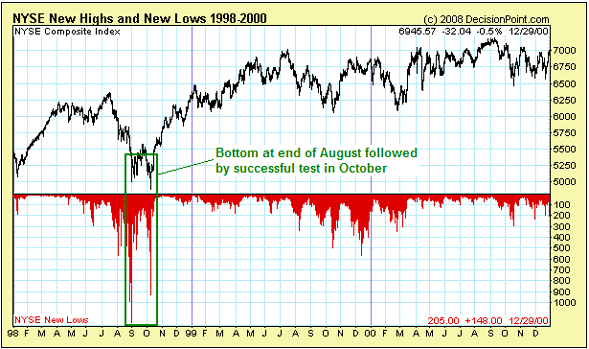
Click Here, or on the image, to see a larger, undistorted image.
Moving along to the famous 1987 selling climax depicted on the chart presented below, notice, again, that the NYSE Composite Index returned to test its panic low before a sustained advance got underway.
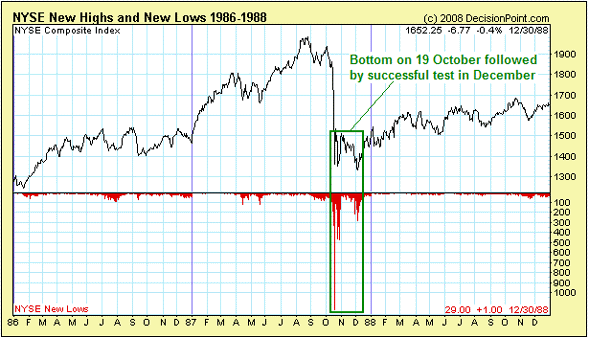
Click Here, or on the image, to see a larger, undistorted image.
Last, but certainly not least, we'll take a look at a chart showing the dramatic May-1973 surge in new lows and its aftermath. The chart displayed below reveals that the selling climax near the end of May-1973— as marked by new lows surging to more than 1100— was followed by a choppy rebound that lasted about 5 months. The market then returned to its downward path.
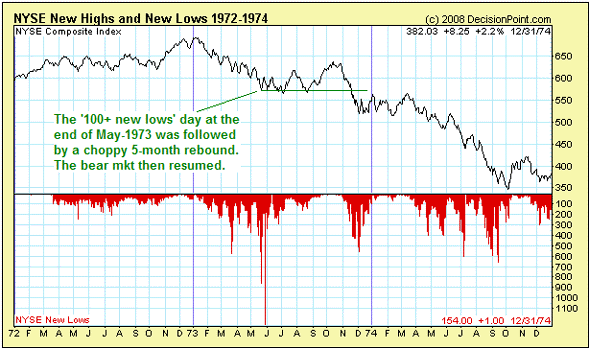
Click Here, or on the image, to see a larger, undistorted image.
Although the recent decline was much steeper than the one that led to the May-1973 selling climax, we think it makes the most sense to compare the current situation with 1973. The reason is that the May-1973 selling climax, like this week's selling climax, occurred in the midst of a secular (very long-term) bear market, whereas the 1987 and 1998 climaxes occurred within the context of a secular bull market.
As an aside, for the past seven years we've consistently maintained that US equities are mired in a secular bear market as defined by long-term downward trends in VALUATIONS (P/E ratios, etc.) and REAL prices (gold-denominated prices). In a high-inflation world it is very important to define the long-term trend in this way, rather than in terms of nominal dollar prices, because it is purchasing power and not monetary value that matters. For example, if the US stock market were rising at 5% per year while the US$ were losing purchasing power at the rate of 10% per year then it would not, in our opinion, be reasonable to claim that US stocks were in a bull market. What we would have, in that situation, is a bear market in the dollar as opposed to a bull market in equities. To say otherwise is to say, in effect, that a million dollars is a million dollars regardless of whether it can buy a beautiful house in the best part of town or an ice-cream cone.
In any case, even if we assume the bearish 1973 parallel, the historical record suggests that the stock market has just made a low that will not be decisively breached for at least 5 months.
Steve Saville
ߧ
Normxxx
______________
The contents of any third-party letters/reports above do not necessarily reflect the opinions or viewpoint of normxxx. They are provided for informational/educational purposes only.
The content of any message or post by normxxx anywhere on this site is not to be construed as constituting market or investment advice. Such is intended for educational purposes only. Individuals should always consult with their own advisors for specific investment advice.
No comments:
Post a Comment