Why The United States Will Face A Decade Of Economic Stagnation And Face A L Shaped Recession.
By Dr. Housing Bubble | 8 September 2008
|
Given the recent positive reading for GDP, some are now doubting that we will even face a recession. This of course is a misnomer and most average Americans realize that our country finds itself in a very tenuous situation. It is very easy to brush off the current talk of economic malaise as simply another business cycle unwinding yet this time there are many fundamental circumstances that simply make this situation a very unique beast.
As baby boomers reach retirement age it could not have happened at a worse time. The economy is on the brink of recession and we are going to face the largest entitlement program drain on our system ever. Social Security was never devised as a retirement or pension program but a large portion of our elderly depend on this income.
There is a baby-boomer age-wave theory proposed by economist Harry Dent that views a peak in the US stock market at 2007 and 2009. His prediction is based on observations that consumer spending peaks at or near age 50. With many boomers starting to retire in the upcoming years the age-wave theory predicts a slow down in the economy.
Generally speaking there are 76 million people that were born between 1946 and 1964. With that said, 2011 will be the first year that the first baby boomers will hit the 65 year age mark [[they've already hit the 62 year, early retirement, mark this year: normxxx]] and the beginning of a long-term trend that will become more reliant on entitlement programs. This is happening just as the largest United States housing bubble is popping. With residential housing prices peaking at nearly $24 trillion only to see about $5 trillion of that disappear in a few short years, the economy is facing constraints at the worst possible times.
We are also seeing consumer inflation pick up in gas, groceries, and healthcare at a time when many boomers are going to be stuck on a fixed income. While prices go up, their monthly payment is fixed. In the following article, we are going to examine 10 very crucial areas in our economy that practically guarantee that for the next decade, we are going to see slow to negative growth in our economy. We’ll examine housing, entitlement programs, and income to try to arrive at a forecast for the next decade.
Factor 1— New Homes Sold
Click Here, or on the image, to see a larger, undistorted image.
Examine the above chart for a minute. Never in our nation’s history have we seen such an epic boom in new homes being sold. For the past decade, much of our economic prosperity was intertwined with the fate of housing. In fact, there have been recent estimates that housing related industries accounted for 30 to 40 percent of job growth since 2000. The peak was reached in the second half of 2005.
At this time homes were flying off of the shelves like the latest hit album and financing was ample to feed this flame [[indeed, it was a prime source of oxygen: normxxx]]. Keep in mind the above chart is for new homes. Thus we can assume that builders were privy to this information and more than willingly participated in an epic housing construction boom to meet this new home demand. Much of the creative financing including the $500 billion in currently outstanding option ARM mortgages helped fuel this run up.
This pace was simply unrealistic since the growth in population was not keeping up. In fact, demographic trends would have pointed to another conclusion. That is, many baby boomers now with empty nests would be selling their homes and downsizing and organically there would be a natural jump in housing inventory on the market [[especially since the "baby bust" followed the boomer generation: normxxx]]. Instead, we had a decade long boom in new home construction that will now contend with the onslaught of baby boomer homes that will hit the market in the next decade.
Factor 2— New Housing Units Started
Click Here, or on the image, to see a larger, undistorted image.
Given the above, builders were quick to catch onto this once in a lifetime trend. Yet what you’ll notice is that new home sales peaked in the second half of 2005 while new housing starts peaked in the summer of 2006. This lag was partly because many builders came late to the game and over estimated the actual demand in the market [[eg, greed: normxxx]]. What they failed to grasp was that much, if not most, of the market was a Ponzi scheme based on pure speculation. This was similar to 1920s Florida real estate except this engulfed numerous metropolitan areas across the nation. States like California, Florida, Nevada, and Arizona are now feeling the brunt of this correction.
The new housing starts and new homes that have been built assure us that we will have plenty of housing for the entire next decade. Even though many are now pointing to the decline in housing construction as a sign that we will move inventory off the market in the next few years, they fail to examine the baby-boomer age-wave theory and fail to realize that many boomers will be selling their homes in the upcoming years which will once again push inventory up. The birth rate has also massively declined since the time of the baby boomers. Take a look at the below chart:
Click Here, or on the image, to see a larger, undistorted image.
*Source: Profutures.com
So the trend is unmistakably for smaller families which of course means that many people do not need bigger places which is ironic given the average size of a home has increased over this time not for necessity, but for other reasons.
Factor 3— Construction Spending
Click Here, or on the image, to see a larger, undistorted image.
It would logically follow that construction spending has now declined as well. Construction spending peaked with new housing starts in 2006. Since then, it has been steadily declining. Given the nature of construction, much of the unemployment in this industry has hurt many other areas. These are generally high paying jobs but also include much of the shadow economy of employment.
Recent data on remittances to Latin America show a major decrease in money being sent back home that nearly parallels the peak in construction spending and contraction. In addition, trucks are a big part of the industry. Construction bodes well for this industry but it has been hit with a one-two punch. First, the industry has contracted but then high fuel costs have also hurt the recreational truck buyer. That is, those that buy not because they need a truck but because they want a truck.
Construction employs a large number of people and this pull back is only going to fuel even higher unemployment which we are already seeing. The idea being postulated that we’ll see this pick up soon is somewhat unfounded. Just as we start clearing the current glut of new housing, which is 2 to 4 years away, we should be seeing a natural organic selling of baby boomer homes.
Not to be macabre, but James Love of BoomerDeathCounter.com states that a Baby Boomer will die every 49.5 seconds in the USA during the year 2008. This number will increase simply because of aging and the natural life process and this will add still more inventory to the overall housing market. In this same vein, boomers will start relying much more heavily on an already over burdened healthcare system. These reasons practically ensure that we will see a decade long contraction in construction as it pertains to residential housing.
Factor 4— Household Debt and Liabilities
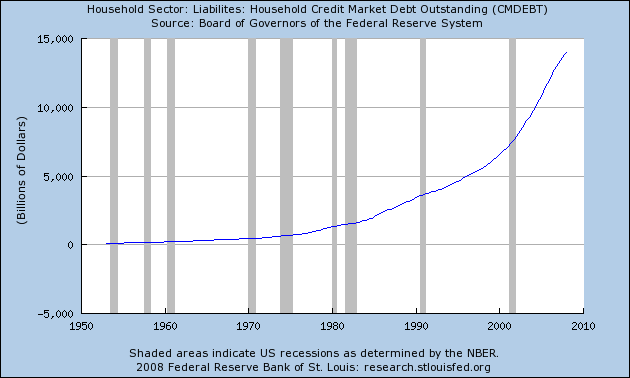
Click Here, or on the image, to see a larger, undistorted image.
It is hard to believe that there is nearly $14 trillion in household debt in the United States. This trumps our nationwide GDP. As I discussed in a previous article as to why the United States will not see a second half recovery, this amount of debt is putting a pinch on the bottom line of many households. A large amount of this debt, approximately $11 trillion, is mortgage debt. But, as the price of housing continues to fall, the amount of debt does not diminish.
That is the challenge that we are facing. Much of the foreclosures that we are seeing are an economically vicious way of reconciling the balance sheet of America. That is, no lender is going to willingly modify a loan by -$200,000, but if an owner cannot make the payment due to the larger economic forces, the lender will get the property back, and will have to contend in the open market with everyone else— including other lenders in a like position— so the house will only 'clear' at the much lower price.
The amount of debt is simply staggering. Debt in itself is not bad, but when you have this much on the balance sheets of American households, what has occurred is that many have already spent today their anticipated future earnings of the next decade [[which may not even arrive as planned: normxxx]]. In a consumerist economy where nearly 70 percent of our economy is based on spending, people are going to be forced to pay off debt instead of consuming. And this can be seen in the following chart.
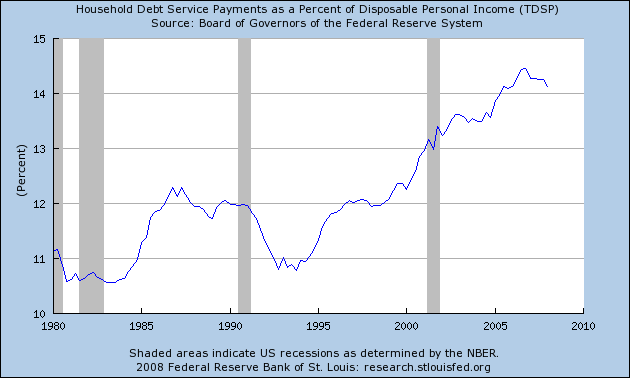
Factor 5— Household debt as a Percent of Disposable Income
Click Here, or on the image, to see a larger, undistorted image.
Since 1980 even with ups and downs in our economy, the percent of a household’s disposal income toward debt payments has steadily increased. Money that can be used to go out and have a nice dinner is now diverted to paying the monthly minimum on your American Express card. This is an increasingly serious problem. This can only go on for so long and given that the household debt has gone from $5 trillion in the mid '90s to the current $14 trillion is simply amazing. Much of this debt increase was due to the epic housing bubble. Never in the history of this country has household debt surpassed GDP until now.
You may be asking, if approximately $11 of the $14 trillion is mortgage debt, what is the rest? The bulk of the remaining $3 trillion is largely unsecured consumer debt. In fact, credit card companies and auto lenders are now starting to see a large increase in defaults and late payments on these items. Why? Well the economy is grinding to a halt and if you lose your job or have a pay cut, all of a sudden that portion of your 'disposable' income that is going to service current debt (that hasn’t much decreased, but can increase greatly with increased, 'punitive' interest rates and penalties) can easily exceed what's available. It becomes a vicious cycle and that is why the debt trap is so deadly.
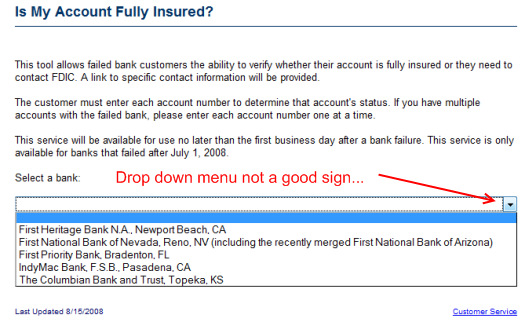
Factor 6— U.S. Banking Facing Major Issues
Click Here, or on the image, to see a larger, undistorted image.
I remember seeing the above chart at the FDIC a few months ago. It had one bank in the 'list'. I had to wonder, why in the world would you put in a drop down menu if you only had one bank on the list? Clearly the FDIC already knew that the United States banking system was going to be facing major long term problems. With the failure of Indymac bank the FDIC initially estimated that the cost would be from $4 to $8 billion. Their initial insurance fund is at $53 billion. Now, recent revisions tell us that the cost will be more like $8.9 billion. With this one bank failure, the FDIC will burn through 16.7 percent of their fund.
They have come out with a recent report that revised the March 2008 number of troubled banks from 90 to 117, an increase of 30 percent in one quarter. In fact, FDIC Chairwoman Shelia Bair is now mentioning that the FDIC may need to seek assistance from the U.S. Treasury (aka, the bank of you and me). Given that U.S. banks have over $6 trillion in deposits, you would think that a mere $53 billion (much of it eaten up at Indymac) would do little to cover even a slight amount of the overall funds. If, as we are expecting, systemic problems arise, we can expect this number to balloon.
Yet why is this going to put the breaks on the economy for the next decade? Banks are now becoming more prudent since much of the money being lent is now their own which puts them on the hook. The "give money to anyone with a pulse model" is finished. I used to get about 20 pieces of mail a week for new credit cards. Now it has dwindled down to about 4 or 5 a week. Now that banks actually have to verify income and ability to pay, it turns out that many Americans do not qualify for loans.
Many areas now require 10, 15, or even 20 percent down to purchase a home. One reader sent me an article from Florida where in some heavily hit areas, lenders are requiring 40 percent down. In California where the median home price is $318,000, that means buyers would need to put down $31,800 or $63,600 plus closing costs. As we are quickly finding out, not many people have this amount of 'ready' money. Even a 5 percent down payment put a large crimp in the market. No money down was a large part of the market.
Given the problems in U.S. banks, many are tightening lending at a time when most people actually need money. Banks do not stay in business doling out charity. As the adage goes, a good borrower is someone who does not need the money. Unfortunately, many people now need the money yet banks are afraid to play with their own money.
Factor 7— Income Inequality
Click Here, or on the image, to see a larger, undistorted image.
*Source: Wikipedia
Even given our decade long housing and credit boom where homeownership soared to record highs, the inequality in wealth in our country has never been so pronounced. People have just learned a quick lesson that debt does not equal wealth. Having items that make you appear wealthy does not mean that you actually have a healthy balance sheet. Look at the above chart.
Only 17.8 percent of United States households make over $100,000 per year. We’ve already highlighted before using a detailed budget that $100,000 does not get you that far anymore especially in areas like California. Indeed, some politicians would have you believe that $5 million is the threshold for middle class— yet only 0.12 percent of American households make over $1.6 million a year.
In the United States only 146,000 households have incomes over $1,500,000, while there are only 11,000 households that make more than $5,500,000. 82.2 percent of all households make under $100,000 per year. Maybe they are betting that you will acquiesce on the tired old line of "no new taxes" instead of looking at who would get the real tax breaks. I think given how divergent this is, we should look more closely at both McCain’s and Obama’s tax proposals:
Click Here, or on the image, to see a larger, undistorted image.
*Source: Washington Post
Things are rarely so clear cut. When you have many of the hedge fund managers and heads of financial institutions making $10 million a year providing products that have actually harmed our economy, there is something seriously wrong. On the Main Street of America, financial innovations which once sounded like a new tonic now is redolent of snake oil. Just as in the Great Depression, Wall Street and its bankers, once seen as the new captains of industry, will be paraded on Capitol Hill and in the courts to be reviled for the damage they have caused.
Things had gotten totally out of control, but this Ponzi scheme is now coming to a painful close. Keep in mind that if we are to be punished for this decade long bubble, and implement and enforce regulations to prevent recurrences, we are going to have to pay the piper dearly. This means living within our means. Can Americans do that for a decade to retool their economy for the long future?
Sadly when we continue to hear gimmicks about fixing 'bucket' issues, it tells us that many Americans only care about the one step that is immediately in front of them. It is time to dig into the data and see the facts for what they are. "No new taxes" is a tired line that can only lead to the death of our economy.
Factor 8— Government Spending
Click Here, or on the image, to see a larger, undistorted image.
*Source: Perotcharts.com
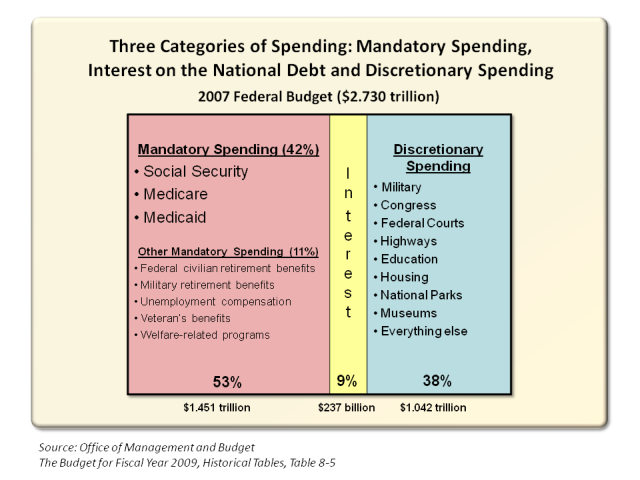
Now we need to come full circle and look at the entitlement programs. For years we have talked about fixing Social Security and Medicare but haven’t done a single thing about it. Guess what? That day has now come. Whether people want to deal with this or not we now have no choice. We spent $1.45 trillion in mandatory spending items including Social Security, Medicare, and Medicaid in 2007. 53% of the $2.73 trillion Federal Budget is based on these fixed items.
Another troubling line item is the $237 billion in interest that we pay each year on debt. The U.S. is simply reflecting the poor management of budgets like U.S. households. Discretionary spending is somewhat of a misleading label. Many items such as the military and defense really are not discretionary since these will not go anywhere. When it comes down to it, only a small amount is left to 'debate' about.
The rest is never even touched by politicians since it is like a third rail in politics. For many of the younger generations, we look at these items and wonder if we will ever even see one Social Security check even though we are putting in more and more money into this fund. Take a look at this chart:
You can see how quickly payroll tax rates have increased over the last few decades. Yet you need to remember that there is currently a cap on this at $102,000. Remember the inequality charts above? What this means is those with the highest incomes pay the least in percentage terms into this fund. 82.2 percent of the population pay every nickel on the above rates into this fund.
Now to be upfront I don’t think simply lifting the cap is going to solve the stunning amount we have to confront. There has to be a shift in how this will work. When Social Security was created, the life expectancy of people wasn’t as high as it is now. It was never crafted as a retirement or pension system yet many Americans now rely on Social Security as a primary source of their retirement income. We are going to have to make some hard choices here. What will that be? Either raise the tax rate or let many folks go without these funds.
That is the flipside of the political equation. Many "no tax" folks are quick to say don’t ever raise taxes yet fail to follow their logical conclusion. Then what then of the 76 million baby boomers that will be retiring in the next few years? That of course is the harder question. In addition, bad fiscal policy by government causing consumer inflation is a hidden tax but many people don’t understand how inflation even works so this is a good way to tax the public.
There is a great book by Christopher Buckley called Boomsday that examines this exact issue. It is a humorous look at this impending entitlement debacle and explores the possibility of generational politics emerging as a major issue. Currently everyone is for Social Security. But how is that going to play out in the future for younger generations if they realize they won’t see any of that money and become a bigger and more powerful voting bloc? This is going to be a major issue and we need to get ready for this.
And what of the 401(k) idea? Well given how the stock market is currently going, you may be happy with a 5 percent return on a guaranteed investment. If the above trends hold, how horrible of a crosswind to see both a sinking stock market when baby boomers will start drawing on their accounts.
Factor 9— The Explosion of Entitlement Programs
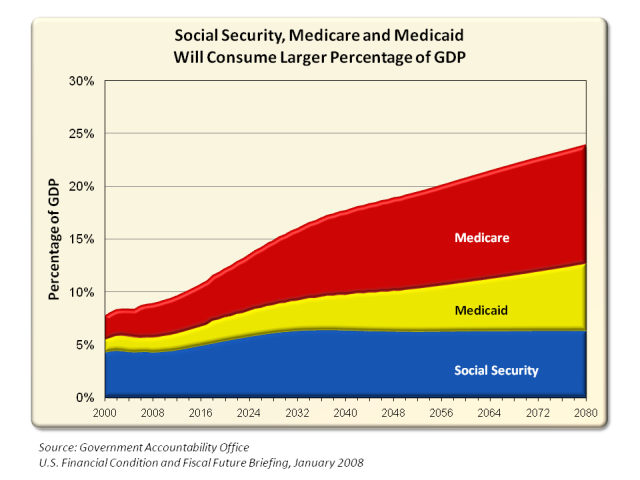
Click Here, or on the image, to see a larger, undistorted image.
*Source: Perotcharts.com
Here is how this oncoming tsunami looks. Currently we spend about 8 percent on Social Security, Medicare, and Medicaid. This is going to explode and if we hit a severe recession, these estimates are going to go higher since we’ll have a lower GDP. In addition, the $9.6 trillion in national debt (which will now go over $10 trillion with Fannie Mae and Freddie Mac and the FDIC) has a large portion of entitlement IOUs given by the United States government. That is, the money that people currently pay into the tax system are being used right now for other government spending including current entitlement outflows.
Remember that lock box talk? Now you know why it was so important but people rather make fun of things they don’t understand. Now it is time to pay up. Keep in mind that these tax receipts are viewed by the government as an income stream only second to the actual income taxes paid. At this rate, there is going to be some serious negotiations for the next decade and either way, this is going to put a clamp on our economic growth for the next decade.
Factor 10— Booming Foreclosures
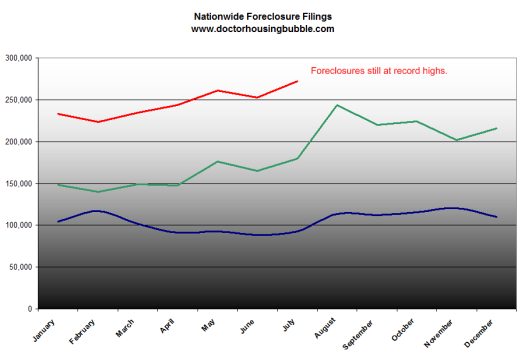
Click Here, or on the image, to see a larger, undistorted image.
The immediate problems of course are with the housing market. Long viewed as the most stable of all investments, housing is no longer a solid rock. This long held belief is being shattered and if housing isn’t safe then what is? Stocks? No. Commodities? Not always. So where do people put their money? Aside from all the bottom callers trying to look for the proverbial housing bottom we are really very far away from seeing a bottom in housing.
They are like a dog chasing its own tail. Once we reach the bottom then what? That is the ultimate reality check. Do they somehow think that we are going to hit the bottom and rebound like this past bubble we just had? No chance. If anything, we’ll be back to seeing housing as a boring and dry investment as it should be seen.
If you look at the above chart monthly foreclosure filings are still at record levels. Before we can acknowledge a bottom we first have to define what a bottom is. If we are looking at prices, nationwide it looks like we will hit a bottom in the second half of 2009 or early 2010. If we look at states like California, we won’t see a bottom in price until May of 2011. If we are defining a 'bottom' as a low in sales, we may already be reaching that point, yet most people associate a bottom with price so given that definition, we are not even close to a bottom as highlighted by the above foreclosure trend.
Keep in mind, that in California nearly half of all sales were foreclosures. These sales by definition are problematic and are thus pushing prices lower. Nationwide foreclosures are making up a large portion of all sales. This will keep prices low. Until the above chart starts declining, then we can realistically talk about a bottom. Until then, it is merely mincing data with sales numbers and minor bumps in the larger trend.
By looking at multiple facets of the economy it is very likely that we will see a L shape recession like Japan did in the 1990s and which it battling with even today. I know many people will argue that we are very different, yet given the housing bubble, our boomer population, and credit contraction, I just don’t see how we avoid a similar fate. People partied this decade in anticipation of the next decade’s prosperity. But now, it is time to pay the check.
.
Real US Housing Losses Are $6 Trillion
By Daniel R. Amerman, CFA | 8 September 2008
Overview
Actual losses in the US real estate market are much higher than what you have been reading in the newspapers recently. Using a combination of official government statistics and the most widely used index of housing values, we will demonstrate that the US real estate market has lost a total of $6 trillion in value in the last two years. We will show that an average house that was worth about $226,000 in 2006 is, once you adjust for inflation, down to a real value of only about $160,000.
To put what a $6 trillion loss is into perspective, we will show that when all factors are taken into account, the two year drop in US real estate values is equivalent to wiping out the entire retirement savings of all 78 million Baby Boomers, and annual housing losses are close to the annual GDP of China. We will close by talking about how this national disaster creates major personal profit opportunities for people who can learn to look beyond the false number of nominal dollars and into the reality of how wealth is rapidly redistributed during times of economic turmoil.
Four Steps To Finding Total Real Estate Losses
To understand the full extent of US real estate value losses requires a four step process: 1) Find the average loss in dollar terms for single family homes; 2) Find the decline in the value of a dollar during the same period; 3) Combine the fall in housing values with the fall in the value of the dollar to find the real housing loss, not in dollars, but in purchasing power, or what a dollar will buy for you; and 4) Determine the loss for the US economy as a whole.
Step 1: Average Loss Per Home (Simple Dollars)
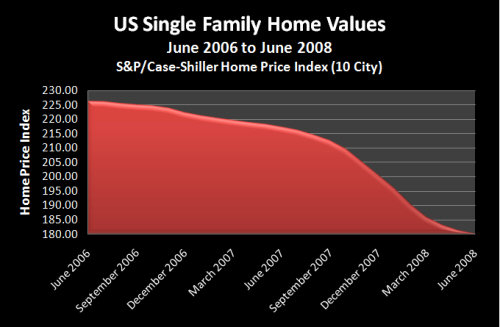
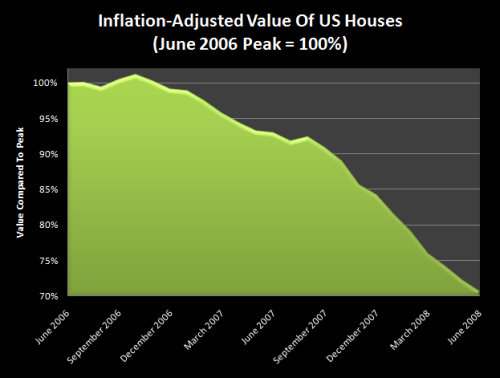
The widely quoted S&P/Case-Shiller Home Price Index reached its maximum value during the month of June, 2006 at a level of 226.29 (10— City Composite). Two years later, by June of 2008, the index had reached a level of 180.38. The fall of 45.91 in index value means a 20.29% decline in the average value of a home in the cities measured. This decline is illustrated in the graph below:
Step 2: Decline In The Value Of A Dollar
The most common measure of the decline in the value of a dollar is the Consumer Price Index (CPI). Unfortunately, it is growing increasingly difficult to find consumers who believe the CPI accurately reflects the prices they are paying in such crucial areas as energy, food or medical care. (This disbelief is particularly strong among those living on a fixed income.) Indeed, when inflation is measured using the same statistical methods of past decades, it is above 10%, according to John Williams of Shadowstats.com.
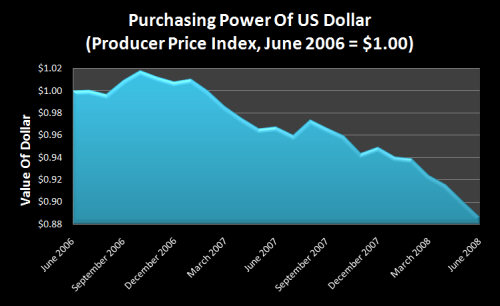
Therefore, for this analysis, we will compromise between the official rate of inflation, and a widespread belief in higher actual rates of inflation, by using a different official government inflation index, that of the Producer Price Index (PPI), which measures wholesale inflation. (To the extent that wholesale inflation tends to lead retail inflation, the two indexes should be converging anyway before too long.) The Producer Price Index in June of 2008 set a 27 year record with a 9.2% twelve month rate of inflation. The last time inflation was this high was the same year that Treasury yields exceeded 15%, and 30 year mortgage rates exceeded 16%. We are in the midst of an extraordinarily rapid destruction of the value of a dollar.
This is shown in the graph below, which illustrates monthly changes in the value of a dollar over the last two years, based upon monthly changes in the PPI. As shown, by June of 2008, a dollar would only buy what 88.7 cents would have purchased in 2006.
Step 3: Adjust Housing Decline For Loss In Value Of Dollar
There is a basic problem with the 20% decline in the dollar value of single family homes over the last two years, and that is that those dollars themselves are worth less than they were two years ago. So, if we want to look at the real value of homes, then we need to adjust our home values for inflation. For dollars themselves aren’t what matter— it is what you can buy with those dollars. The chart below shows what happens when we combine the 20% decline in the real estate index with the 11% decline in the value of the dollar.
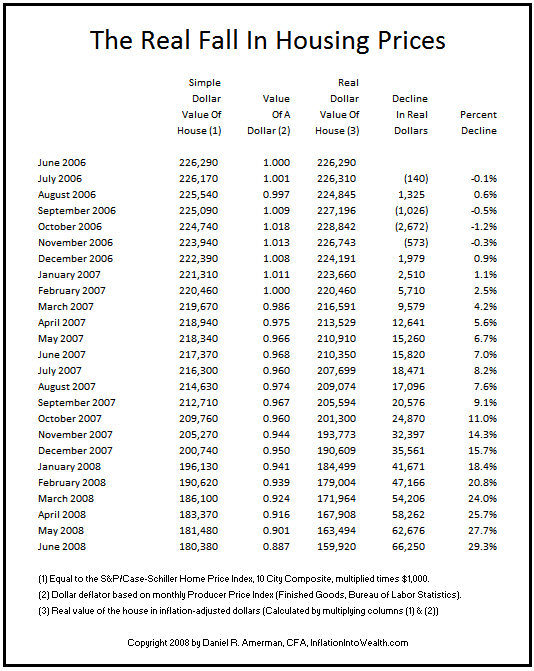
As you can see by following the June 2007 line, twelve months after the real estate peak, the index value of the average house was down 9 points, or 4.0%. However, the value of the dollar had also fallen 3.2% during that time, so that by December a dollar would only buy what 96.8 cents would have bought in June. When we combine the two, with 4% fewer dollars and each of those dollars being worth 3.2% less, then on a real (purchasing power adjusted basis) the average homeowner lost 7.0% of the value of their home during that year, as can be seen in the rightmost column. In other words, real homeowner losses were 75% greater than what was widely reported.
As we go forward to December of2007, eighteen months after the peak, the decline in the value of the housing market was really starting to pick up, with a loss in the index of 26 points, or 11.3%. Unfortunately, the rate of inflation was also beginning to pick up, and the dollar had fallen 5% over the eighteen months, meaning a dollar would only buy what 95 cents did in June of 2006. So a house is worth 88.7 cents on the dollar, but the dollar itself is only worth 95 cents, and when we combine the two, the real value of the average house fell 15.7%. This was about 40% greater than what was widely reported.
By the time we reach June of 2008, then as shown above, the real estate index was down to 180.38, a full 20% decline. The dollar was down to 88.7 cents, as it had lost 11.3% of it’s value. When we combine the two, we say that a average $226,290 house in 2006 only has a market value of $180,380 by June of 2008, and when we also include that a 2008 dollar is only worth 88.7 cents— then the real value of our house is not $180,380, but $159,920.
When we adjust for inflation, a house that was worth $226,000 in 2006, is down to a real value of only $160,000 in 2008. Which means the real dollar loss is not $45,910— but $66,250. Thus, the real percentage loss is not 20%— but 30%. The real loss in homeowner wealth has been a full 50% greater than what is being widely reported in the media.
Step Four: Add Up Losses For All Us Households
How big of a blow is a 30% decline in housing values to the US economy and national wealth? For the answer to that, we will turn to the Federal Reserve. As of 2006, Federal Reserve statistics show that total household real estate assets were $19.8 trillion (Statistical release Z.1 (Flow of Funds), table B.100( Household Balance sheet), line 4). So, we start with $19.8 trillion and multiply times the 29.3% real two year decline in home values that is in the bottom right hand corner of the chart.
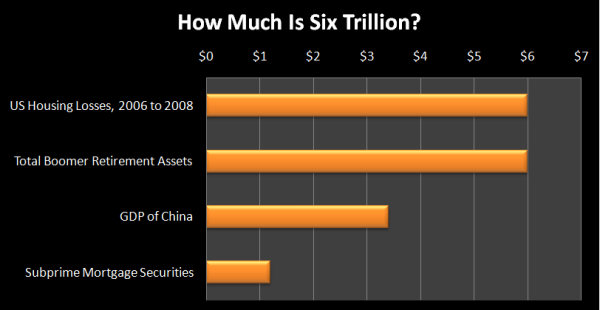
$20 trillion in 2006 real estate, times 30% inflation-adjusted real estate losses between 2006 and 2008, is a $6 trillion dollar loss in homeowner wealth (rounded numbers). What is $6 trillion? Numbers that large are difficult to grasp, but 6 trillion is equal to 6 million, times 1 million. So a six trillion dollar loss is equal to six million people each having a million dollars, and each having their entire net worth wiped out. Six million millionaires, each losing every penny.
Another way of viewing $6 trillion is that as of 2006, it was equal to the sum of Baby Boomer retirement account investments, as well as pension investments dedicated to funding Boomer retirements (a detailed methodology for the $6 trillion in 2006 figure can be found in my previous research report "Adding Up $44 Trillion In Boomer Wealth Expectations"). A $6 trillion drop in value is equal to wiping out 100% of the retirement savings accounts and pension investment values for all 78 million US Baby Boomers between ages 44 and 62.
For additional perspective on the value of $6 trillion, the Chinese economy reached a GDP of $3.4 trillion in 2007, according to the Chinese news agency Xinhua. That means that over the last two years, the US housing market has been losing value at a rate almost equal to the size of the entire Chinese economy, the economic juggernaut that is currently driving much of the growth of the global economy.
(The Purchasing Power Parity (PPP) measure of the Chinese economy at $7 trillion for 2007 (as calculated in the CIA Factbook) is a much better measure than a GDP that is based upon blatantly manipulated currency values, but using such currency values as if a (non-existent) fair market had established them is the norm for financial reporting, so we’ll use it here. Even if we use the PPP, the loss in wealth compared to the Chinese economy is still extraordinary.)
Yet another way of looking at the size of $6 trillion is to compare it to the source of much of the plunge in value for real estate, which is the subprime mortgage securities market. The subprime debacle, which has shaken the global financial system and ravaged four of the strongest financial institutions in the US (Fannie, Freddie, MBIA and AMBAC), took place in a $1.2 trillion market. The two year loss in US housing values is five times the size of the total subprime mortgage securities market. As can readily be seen below, the two year collapse in US housing values is a financial disaster of epic proportions.
(Note that the $6 trillion loss shown does not reconcile with Federal Reserve real estate values for 2008, which show total real estate asset values of $19.7 trillion as of the first quarter, meaning essentially no fall in real estate values. Curiously enough, the official government statistics seem to do a remarkably good job of rising fast with rising real estate values, yet, don’t seem to reflect bad news at all. Much like some of the most interesting inflation numbers that the government has been using lately to claim that the economy is still growing fast, as measured by the GDP. More on this subject can be found in my article "Inflation Index Manipulation: Theft By Statistics".)
Personal Implications & Taking Actions
Let’s think for a moment about recent financial history. How about the collective "wisdom" of the markets pushing the NASDAQ to 5,000— and then 80% of that value quickly imploding as the NASDQ fell to 1,000. Then there is this most recent episode, where it appears the collective brilliance of the markets ran up a little $6 trillion (and still counting) pricing mistake. Just a little rounding error, twice the size of the economy of China. Now, let’s think about the safety of your retirement and other investment assets.
When you direct your IRA and 401 plans, when you plan your retirement income, what is your source of safety for your stock and bond investments? In the financial profession, your ultimate source of safety is what is known as the "Efficient Market Hypothesis", which just basically says that the awesome wisdom and intelligence of the markets makes sure that all securities are always fairly priced.
Given what we’ve seen just in the last decade— how confident are you about this collective brilliance of the markets? Confident enough to risk every penny of your retirement savings? Yet, you must invest and invest well— or inflation will eat your savings, and you will be impoverished anyway. So, what do you do?
A place to start is to think very seriously about reducing your ownership of financial assets. If you are investing for retirement and your portfolio of stocks and bonds gets taken down by broad market developments similar to what has already happened with real estate and tech stocks just in the last seven years, then you may never have the chance to replace retirement savings. There is a powerful, powerful case for moving a substantial portion of your assets into tangible assets. Good examples of tangible assets include gold, silver, commodities, farmland and energy— and yes, real estate. Not at the peak of a bubble, but at the right time and the right price.
The next thing you should do is very seriously think about is whether crisis leads to opportunity, in ways that go well beyond a simple strategy of only buying tangible assets. As a prominent recent example, John Paulson saw the crisis that was coming in subprime mortgages, researched and educated himself on this area (which had not been his field of expertise), and he turned the crisis into a $3-$4 billion personal payday in 2007. If you're not a hedge fund manager like Paulson, you may not have the tools that he used to turn a market crisis into personal billions. That’s OK, because Paulson didn’t start with the tools either. He started with educating himself, learning about a new area, until he came up with a novel way to profit from disaster. A method that wasn’t in the financial textbooks, and that he didn’t find by reading a financial columnist in the paper.
You have more tools than you may think, some of which may surprise you. Tools which can give you the opportunity to turn financial disaster into personal net worth. There are ways you can use those tools to turn the $6 trillion fall in real estate values in combination with the destruction of the US dollar into perhaps the greatest real wealth-building opportunity of your life, on a long-term and tax-advantaged basis.
But, if you want this to happen— then education is the essential first step. You are going to have to not just understand, but to master some of the financial forces and methods in play here. You will have to learn how to turn the destruction of paper wealth into real wealth. With Turning Inflation Into Wealth being the first key step. My best wishes to you for turning this challenge into an extraordinary personal opportunity.
Do you know how to Turn Inflation Into Wealth? To position yourself so that inflation will redistribute real wealth to you, and the higher the rate of inflation— the more your after-inflation net worth grows? Do you know how to achieve these gains on a long-term and tax-advantaged basis? Do you know how to potentially triple your after-tax and after-inflation returns through Reversing The Inflation Tax? So that instead of paying real taxes on illusionary income, you are paying illusionary taxes on real increases in net worth? These are among the many topics covered in the free "Turning Inflation Into Wealth" Mini-Course. Starting simple, this course delivers a series of 10-15 minute readings, with each reading building on the knowledge and information contained in previous readings. More information on the course is available at http://InflationIntoWealth.com
Contact Information:
Daniel R. Amerman, Cfa
Website: http://InflationIntoWealth.com/
ߧ
Normxxx
______________
The contents of any third-party letters/reports above do not necessarily reflect the opinions or viewpoint of normxxx. They are provided for informational/educational purposes only.
The content of any message or post by normxxx anywhere on this site is not to be construed as constituting market or investment advice. Such is intended for educational purposes only. Individuals should always consult with their own advisors for specific investment advice.
No comments:
Post a Comment