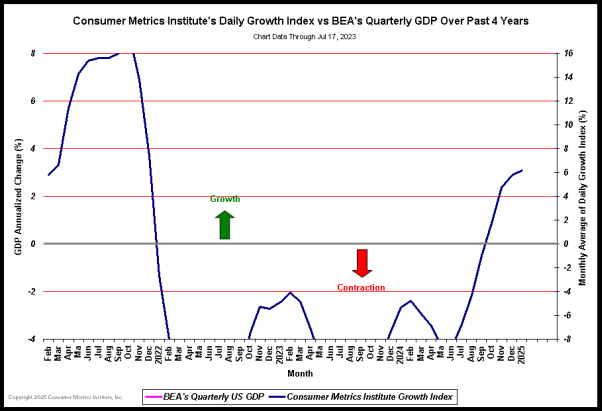
Growth Index Past 4 Years(1):
Click Here, or on the image, to see a larger, undistorted image.
Notes:
(1) The Consumer Metrics Institute's 91-day 'Trailing Quarter' Growth Index -vs- U.S. Department of Commerce's Quarterly GDP Growth Rates over past 4 years. The quarterly GDP growth rates are shown as 3-month plateaus in the graph. The Consumer Metrics Institute's Growth Index is plotted as a monthly average. Please see our Frequently Asked Questions page for a more complete description of our Growth Index.
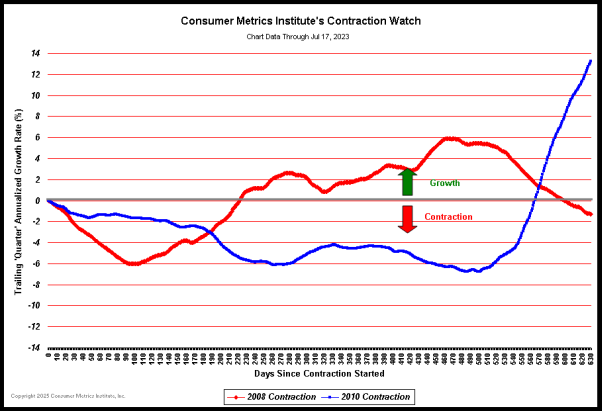
Consumer Metrics Institute's Contraction Watch(2):
Click Here, or on the image, to see a larger, undistorted image.
Notes:
(2) The comparison of the 91-Day Growth Indexes during the 'quarter' immediately following the commencement of a contraction. The quarterly GDP growth rates are shown as 3-month plateaus in the graph. The Consumer Metrics Institute's Growth Index is plotted as a monthly average. The contraction events of 2006, 2008 and 2010 are shown against the same scale of annualized contraction.
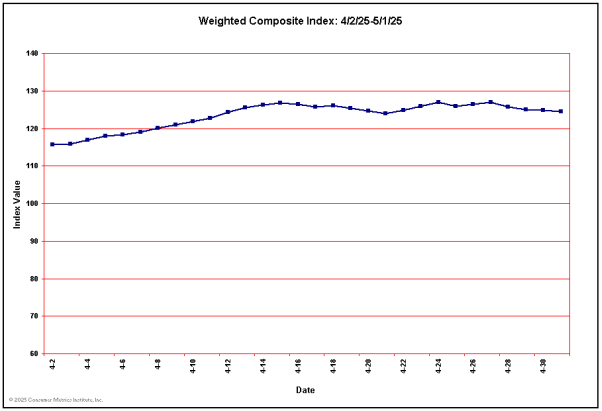
Current Weighted Composite & Sector Index Values
Click Here, or on the image, to see a larger, undistorted image.
Last 10 Weighted Composite Index Values (2010)
Date:    06/04    06/05    06/06    06/07    06/08    06/09    06/10    06/11    06/12    06/13
Value:   95.43    95.67    96.08    95.81    96.04    96.39    96.43    96.52    96.27    95.53
Current Values for Each of the Sector Indexes
  Sector: Automotive Entertainment Financial Health Household Housing Recreation Retail Technology Travel
Value(3):   98.92      97.24         94.89   108.99   101.75    90.76   100.35   105.24    ..93.36    98.81
Notes:
(3) The 10 sectors contribute to our Weighted Composite Index according to weightings provided for their various sub-components by the United States Department of Commerce's National Income and Product Accounts ('NIPA') Tables (see our FAQs page for further explanations). In general, components in our Housing Sector have the highest weightings for durable goods in the NIPA matrix, while components in our Retail Sector contribute dynamically to many different line items in the weighting matrix, depending on specific goods involved.
No comments:
Post a Comment