Thursday, April 30, 2009

Market Commentary

Market Commentary
Click here for a link to ORIGINAL article:

By Capital Multiplier | 30 April 2009

One of the notable features of the stock market’s recent rally has been the surge in battered U.S. banks and financials in anticipation of the results of the American government’s "stress tests" on the nation's 19 largest financial institutions. Recently, The Federal Reserve released details of how it conducted the "stress tests" and announced that "most banks currently have capital levels well in excess of the amounts needed to be well capitalized." There you have it folks: those U.S. government bureaucrats who did not see this global financial crisis coming and who have so far done everything in their power to rescue those (favored) Wall street banks (of which Lehman Bros. was not one), and to hell with the global economy, have now declared the U.S. banking system to be "OK" and there is nothing to worry about. Must be time to back up the truck and buy bank stocks, right?

Not so fast! If there is one person who can be considered an expert on this topic it's William Black, former senior bank regulator who served as counsel to the Federal Home Loan Bank Board during the S&L Crisis of the 1980s. In recent interviews Mr. Black has described these bank stress tests as "a complete sham," and called the Treasury's toxic debt plan, "an enormous taxpayer subsidy for the people who caused the problem." According to Mr. Black,
"With most of America's biggest banks insolvent, you have, in essence, a multi-trillion dollar cover-up by publicly traded entities, which amounts to felony securities fraud on a massive scale. These firms will ultimately have to be forced into receivership, the management and boards stripped of office, title, and compensation. Right now, things don't look good. We are using taxpayer money via AIG to secretly bail out European banks like Société Générale, Deutsche Bank, and UBS— and even our own Goldman Sachs. The government is reluctant to admit the depth of the problem, because to do so would force it to put some of America's biggest financial institutions into receivership....And you have seen no regulatory action against what amounts to a $2 trillion accounting fraud."

Global economic reports showed further signs of deterioration last week as:
i) According to the latest report from the International Monetary Fund, losses for global financial institutions due to the current recession and credit crisis may reach $4.1 TRILLION by late next year! In a separate report, the IMF described the current downturn as "by far the deepest global recession since the Great Depression," and predicted the global economy will shrink 1.3%this year accompanied by growing unemployment levels worldwide,
ii) U.S. initial jobless claims rose last week to 640,000 while the number of people staying on jobless benefit rolls rose to a record 6.14 million last week,
iii) According to the National Association of Realtors, U.S. existing home sales fell 3% in March to a seasonally adjusted annual rate of 4.57 million units accompanied by another 12.5% year-over-year decline in the median sales price of existing homes,
iv) According to Britain's Office for National Statistics, the U.K. economy shrank 1.9% in the first quarter marking the sharpest decline in the country's GDP since 1979! The weak economy continues to take a heavy toll on the British job market pushing the unemployment rate to its highest level in 12 years…,
v) Spain's unemployment rate soared to 17.4% last month— with nearly 2 million jobs lost in just the past 12 months— as the European country continues to suffer the painful aftermath of one the biggest housing bubbles in history, and
vi) Reckless government spending plans continued to push U.S. interest rates higher last week with yields on benchmark 10-year notes touching their highest level in five weeks in anticipation of a flood of new supply. This could have significant negative ramifications for the housing market by pushing mortgage rates higher from their recent record low levels
vii) While there have been a few nascent signs of economic stabilization in recent weeks, the overall global macroeconomic scenario remains bleak because the reckless and irresponsible actions of global policymakers are increasing the risks in the global financial system! After their recent significant rally, stocks look ripe for a sizeable pullback. The depth of that pullback could provide important clues about future market direction.

ߧ

Normxxx    
______________

The contents of any third-party letters/reports above do not necessarily reflect the opinions or viewpoint of normxxx. They are provided for informational/educational purposes only.

The content of any message or post by normxxx anywhere on this site is not to be construed as constituting market or investment advice. Such is intended for educational purposes only. Individuals should always consult with their own advisors for specific investment advice.

Wednesday, April 29, 2009

The 2012 Apocalypse

The 2012 Apocalypse— And How To Stop It

By Brandon Keim, Wired.com | 30 April 2009

April 17, 2009 | 2:37 Pm | Categories: Space, Survival

For scary speculation about the end of civilization in 2012, people usually turn to followers of cryptic Mayan prophecy, not NASA scientists. But that’s exactly what a group of researchers assembled at NASA described in a chilling report issued earlier this year on the destructive potential of solar storms.

Entitled
"Severe Space Weather Events— Understanding Societal and Economic Impacts," it describes the consequences of solar flares unleashing waves of energy that could disrupt Earth’s magnetic field, overwhelming high-voltage transformers with vast electrical currents and short-circuiting energy grids. Such a catastrophe would cost the United States "$1 trillion to $2 trillion in the first year," concluded the panel, and "full recovery could take 4 to 10 years." That would, of course, be just a fraction of global damages.

Good-bye, civilization.

Worse yet, the next period of intense solar activity is expected in 2012, and coincides with the presence of an unusually large hole in Earth’s geomagnetic shield. But the report received relatively little attention, perhaps because of 2012’s supernatural connotations. Mayan astronomers supposedly predicted that 2012 would mark the calamitous "birth of a new era".

Whether the Mayans were on to something, or this is all just a chilling coincidence, won’t be known for several years. But according to Lawrence Joseph, author of "Wired.com: A Scientific Investigation into Civilization’s End," "I’ve been following this topic for almost five years, and it wasn’t until the report came out that this really began to freak me out." Wired.com talked to Joseph and John Kappenman, CEO of electromagnetic damage consulting company MetaTech, about the possibility of a geomagnetic apocalypse— and how to stop it.

Wired.com: What’s the problem?

John Kappenman: We’ve got a big, interconnected grid that spans across the country. Over the years, higher and higher operating voltages have been added to it. This has escalated our vulnerability to geomagnetic storms. These are not a new thing. They’ve probably been occurring for as long as the sun has been around. It’s just that we’ve been unknowingly building an infrastructure that’s acting more and more like an antenna for geomagnetic storms.

Wired.com: What do you mean by antenna?

Kappenman: Large currents circulate in the network, coming up from the earth through ground connections at large transformers. We need these for safety reasons, but ground connections provide entry paths for charges that could disrupt the grid.

Wired.com: What’s your solution?

Kappenman: What we’re proposing is to add some fairly small and inexpensive resistors in the transformers’ ground onnections. The addition of that little bit of resistance would significantly reduce the amount of the geomagnetically induced currents that flow into the grid.

Wired.com: What does it look like?

Kappenman: In its simplest form, it’s something that might be made out of cast iron or stainless steel, about the size of a washing machine.

Wired.com: How much would it cost?

Kappenman: We’re still at the conceptual design phase, but we think it’s do-able for $40,000 or less per resistor. That’s less than what you pay for insurance for a transformer.

Wired.com: And less than what you’d willingly pay for insurance on civilization.

Kappenman: If you’re talking about the United States, there are about 5,000 transformers to consider this for. The Electromagnetic Pulse Commission recommended it in a report they sent to Congress last year. We’re talking about $150 million or so. It’s pretty small in the grand scheme of things. Big power lines and substations can withstand all the other known environmental challenges. The problem with geomagnetic storms is that we never really understood them as a vulnerability, and had a design code that took them into account.

Wired.com: Can it be done in time?

Kappenman: I’m not in the camp that’s certain a big storm will occur in 2012. But given time, a big storm is certain to occur in the future. They have in the past, and they will again. They’re about one-in-400-year events. That doesn’t mean it will be 2012. It’s just as likely that it could occur next week.

Wired.com: Do you think it’s coincidence that the Mayans predicted apocalypse on the exact date when astronomers say the sun will next reach a period of maximum turbulence?

Lawrence Joseph: I have enormous respect for Mayan astronomers. It disinclines me to dismiss this as a coincidence. But I recommend people verify that the Mayans prophesied what people say they did. I went to Guatemala and spent a week with two Mayan shamans who spent 20 years talking to other shamans about the prophecies. They confirmed that the Maya do see 2012 as a great turning point. Not the end of the world, not the great off-switch in the sky, but the birth of 'the fifth age'.

Wired.com: Isn’t a great off-switch in the sky exactly what’s described in the report?

Joseph: The chair of the NASA workshop was Dan Baker at the Laboratory for Atmospheric and Space Physics. Some of his comments, and the comments he approved in the report, are very strong about the potential connection between coronal mass ejections and power grids here on Earth. There’s a direct relationship between how technologically sophisticated a society is and how badly it could be hurt. That’s the meta-message of the report.

I had the good fortune last week to meet with John Kappenman at MetaTech. He took me through a meticulous two-hour presentation about just how vulnerable the power grid is, and how it becomes more vulnerable as higher voltages are sent across it. He sees it as a big antenna for space weather outbursts.

Wired.com: Why is it so vulnerable?

Joseph: Ultra-high voltage transformers become more finicky as energy demands are greater. Around 50 percent already can’t handle the current they’re designed for. A little extra current coming in at odd times can slip them over the edge.

The ultra-high voltage transformers, the 500,000- and 700,000-kilovolt transformers, are particularly vulnerable. The United States uses more of these than anyone else. China is trying to implement some million-kilovolt transformers, but I’m not sure they’re online yet.

Kappenman also points out that when the transformers blow, they can’t be fixed in the field. They often can’t be fixed at all. And, right now, there’s a one- to three-year lag time between placing an order and getting a new one.

According to Kappenman, there’s an as-yet-untested plan for inserting ground resistors into the power grid. It makes the handling a little more complicated, but apparently isn’t anything the operators can’t handle. I’m not sure he’d say these could be in place by 2012, as it’s difficult to establish standards, and utilities are generally regulated on a state-by-state basis. You’d have quite a legal thicket. But it still might be possible to get some measure of protection in by the next solar climax.

Wired.com: Why can’t we just shut down the grid when we see a storm coming, and start it up again afterwards?

Joseph: Power grid operators now rely on one satellite called ACE, which sits about a million miles out from Earth in what’s called the gravity well, the balancing point between sun and earth. It was designed to run for five years. It’s 11 years old, is losing steam, and there are no plans to replace it.

ACE provides about 15 to 45 minutes of heads-up to power plant operators if something’s coming in. They can shunt loads, or shut different parts of the grid. But to just shut the grid off and restart it is a $10 billion proposition, and there is lots of resistance to doing so. Many times these storms hit at the north pole, and don’t move south far enough to hit us. It’s a difficult call to make, and false alarms really piss people off. Lots of money is lost and damage incurred. But in Kappenman’s view, and in lots of others, this time burnt could really mean burnt.

Wired.com: Do you live your life differently now?

Joseph: I’ve been following this topic for almost five years. It wasn’t until the report came out that it began to freak me out. Up until this point, I firmly believed that the possibility of 2012 being catastrophic in some way was worth investigating. The report made it a little too real. That document can’t be ignored. And it was even written before the THEMIS satellite discovered a gigantic hole in Earth’s magnetic shield.

Ten or twenty times more particles are coming through this hole than expected. And astronomers predict that the way the sun’s polarity will flip in 2012 will make it point exactly the way we don’t want it to in terms of evading Earth’s magnetic field. It’s an astonoshingly bad set of coincidences.

Wired.com: If Barack Obama said, "Lets’ prepare," and there weren’t any bureaucratic hurdles, could we still be ready in time?

Joseph: I believe so. I’d ask the President to slipstream behind stimulus package funds already appropriated for smart grids, which are supposed to improve grid efficiency and help transfer high energies at peak times. There’s a framework there. Working within that, you could carve out some money for the ground resistors program, if those tests work, and have the initial momentum for cutting through the red tape. It’d be a place to start.

Tuesday, April 28, 2009

The Capital Well Is Running Dry

The Capital Well Is Running Dry And Some Economies Will Wither

By Ambrose Evans-Pritchard | 26 April 2009

The world is running out of capital. We cannot take it for granted that the global bond markets will prove deep enough to fund the $6 trillion or so needed for the Obama fiscal package, US-European bank bail-outs, and ballooning deficits almost everywhere.

Unless this capital is forthcoming, a clutch of countries will prove unable to roll over their debts at a bearable cost. Those that cannot print money to tide them through, either because they no longer have a national currency (Ireland, Club Med), or because they borrowed abroad (East Europe), run the biggest risk of default. Traders already whisper that some governments are buying their own debt through proxies at bond auctions to keep up illusions— not to be confused with transparent buying by central banks under quantitative easing. This cannot continue for long.

Commerzbank said every European bond auction is turning into an "event risk". Britain too finds itself some way down the AAA pecking order as it tries to sell £220bn of Gilts this year to irascible investors, astonished by 5% deficits into the middle of the next decade.

US hedge fund Hayman Advisers is betting on the biggest wave of state bankruptcies and restructurings since 1934. The worst profiles are almost all in Europe— the epicentre of leverage, and denial. As the IMF said last week, Europe's banks have written down 17% of their losses— American banks have swallowed half.

"We have spent a good part of six months combing through the world's sovereign balance sheets to understand how much leverage we are dealing with. The results are shocking," said Hayman's Kyle Bass. It looked easy for Western governments during the credit bubble, when China, Russia, emerging Asia, and petro-powers were accumulating $1.3 trillion a year in reserves, recycling this wealth back into US Treasuries and agency debt, or European bonds.

The tap has been turned off. These countries have become net sellers. Central bank holdings have fallen by $248bn to $6.7 trillion over the last six months. The oil crash has forced both Russia and Venezuela to slash reserves by a third. China let slip last week that it would use more of its $40bn monthly surplus to shore up growth at home and invest in harder assets— perhaps mining companies.

The National Institute for Economic and Social Research (NIESR) said last week that, since UK debt topped 200% of GDP after the Second World War, we can comfortably manage the debt-load in this debacle (80% to 100%). Variants of this argument are often made for the rest of the OECD club.

But our world is nothing like the late 1940s, when large families were rearing the workforce that would master the debt. Today we face demographic retreat. West and East are both tipping into old-aged atrophy (though the US is in best shape among the OECD, nota bene).

Japan's $1.5 trillion state pension fund— the world's biggest— dropped a bombshell this month. It will start selling holdings of Japanese state bonds this year to cover a $40bn shortfall on its books. So how is the Ministry of Finance going to fund a sovereign debt expected to reach 200% of GDP by 2010— also the world's biggest— even assuming that Japan's industry recovers from its 38% crash?

Japan is the first country to face a shrinking workforce in absolute terms, crossing the dreaded line in 2005. Its army of pensioners is dipping into the collective coffers. Japan's savings rate has fallen from 14% of GDP to 2% since 1990. Such a fate looms for Germany, Italy, Korea, Eastern Europe, and eventually China as well.

So where is the $6 trillion going to come from this year, and beyond? For now we must fall back on the Fed, the Bank of England, and fellow central banks, relying on QE (printing money) to pay for our schools, roads, and administration. It is necessary, alas, to stave off debt deflation. But it is also a slippery slope, as Fed hawks keep reminding their chairman Ben Bernanke.

Threadneedle Street may soon have to double its dose to £150bn, increasing the Gilt load that must eventually be fed back onto the market. The longer this goes on, the bigger the headache later. The Fed is in much the same bind. One wonders if Mr Bernanke regrets saying so blithely that Washington can create unlimited dollars "at essentially no cost".

Hayman Advisers says the default threat lies in the cocktail of spiralling public debt and the liabilities of banks— like RBS, Fortis, or Hypo Real— that are landing on sovereign ledger books. "The crux of the problem is not sub-prime, or Alt-A mortgage loans, or this or that bank. Governments around the world have allowed their banking systems to grow unchecked, in some cases growing into an untenable liability for the host country," said Mr Bass.

A disturbing number of states look like Iceland [[liabilities at 8.5 times GDP: normxxx]] once you dig into the entrails, and most are in Europe where liabilities average 4.2 times GDP, compared with 60%-70% for the US. "There could be a cluster of defaults over the next three years, possibly sooner," he said.

Research by former IMF chief economist Ken Rogoff and professor Carmen Reinhart found that spasms of default occur every several generations, each time shattering the illusions of bondholders. Half the world succumbed in the 1830s and again in the 1930s. The G20 deal to triple the IMF's fire-fighting fund to $750bn buys time for the likes of Ukraine and Argentina. But the deeper malaise is that so many of the IMF's backers are themselves exhausting their credit lines and cultural reserves.

Great bankruptcies change the world. Spain's defaults under Philip II ruined the Catholic banking dynasties of Italy and south Germany. It shifted the locus of financial and commercial power to Amsterdam. Anglo-Dutch forces were able to halt the Counter-Reformation, free northern Europe from absolutism, and break into North America.

Who knows what revolutions may come from this crisis if it reaches to the level of defaults by the major countries. My hunch is that it would expose Europe's deep fatigue— brutally so— reducing the Old World to a backwater. Whether US hegemony remains intact is an open question. I would bet on a US-China condominium for a quarter century, or just G2 for short.

ߧ

Normxxx    
______________

The contents of any third-party letters/reports above do not necessarily reflect the opinions or viewpoint of normxxx. They are provided for informational/educational purposes only.

The content of any message or post by normxxx anywhere on this site is not to be construed as constituting market or investment advice. Such is intended for educational purposes only. Individuals should always consult with their own advisors for specific investment advice.

Cycle Revisited

Cycle Revisited

By Howard Ruff, The Ruff Times | 28 April 2009

John Williams publishes the Shadow Government Statistics newsletter (www.shadowstats.com). He is an amazing professional economist with a great grasp of the real economy. He and I have arrived at the same conclusions about almost everything in the economy, despite the fact that we approach it from totally different directions: me from the fundamentals, and he from a real technical and numbers point of view.

I am now in John’s home in Oakland, California, looking past the government numbers to get his views on the world as it really is. Shadow Government Statistics reconstructs published government statistics the accurate way we used to do it that reflects reality, rather than the way these numbers are now manipulated, and comes up with different conclusions about the economy, such as the Consumer Price Index (CPI), and other revealing areas published by government.

I trust John’s numbers because the government has been manipulating and restating these numbers for purely political purposes.

HJR: John is it necessary to recreate government statistics to show what you feel is reality, and how you have recreated them? I’d like some examples.

JW: Howard, I’ve been a consulting economist for about 27 years. I found early on that to make meaningful forecasts I had to have accurate information. It was evident early on that there were big inaccuracies in government reporting that I surveyed, e.g., at conventios of the National Association of Business Economists. Some economists have to make real-world forecasts, as opposed to those economists employed by Wall Street to come to up with 'happy stories' to encourage people to buy stocks and bonds.

I asked them what they considered the quality of government statistics to be. Most thought the numbers were very poor quality. And, political manipulation of the numbers tends to increase in election years. I talked to the chief economist for a large retail chain, and he told me that the retail sales reports were absolutely no good, but he thought the money-supply numbers were pretty good.

Next was an economist for a major bank. He said the money-supply numbers were not very good, but he thought the retail-sales numbers are pretty good. The more someone knew about a given statistic, the greater the problems he had with the numbers.

Over time public perceptions increasingly varied from what the government was reporting because the government kept changing methodologies, and usually tended to build a downside bias to the economic statistics related to unemployment or the Consumer Price Index (inflation), or an upside bias to those related to the GDP— the broad measure of economies.

When it became popularly used in auto-union contracts after WWII, the concept of the Consumer Price Index was fairly simple. But they wanted to measure changes in the cost of living, and they needed to maintain a constant standard of living. That was the traditional definition; the way the CPI had been designed.

That held pretty much in place until we got into the 1990s when Alan Greenspan and Michael Boskin, the head of The Council of Economic Advisors for the first Bush Administration, started talking about how the CPI really overstated inflation. The rationale was that when steak goes up in price, people buy more hamburger instead of steak; therefore you should reflect the substitution in the CPI(!)

That is not the concept of a constant standard of living; it is the concept of a declining standard of living that has no value to anyone other than politicians in Washington. They succeeded in reducing the reported level of inflation, which reduced cost-of-living adjustments in Social Security checks. Because of the changes in the 1990s, our Social Security checks are about half what they should be!

There have been different definitions [of unemployment] over time. The government itself publishes six levels of unemployment from what they call "U-1" through "U-6." The popularly followed measure is called "U-3." Right now they say it is around 8.6 percent

The broadest measure published by the government deletes "the discouraged workers" and people who are marginally attached to the economy. This is close to 16 percent. The key there is that the "discouraged workers" are people who consider themselves to be unemployed. They know whether or not they have jobs. The Discouraged Worker hasn’t been out looking for work because there are no jobs to be had for one with his skills in his area.

Up until 1994, those discouraged workers wouldn’t have had to specify how long the'd been discouraged. After that, if they were discouraged, the government simply wouldn’t add them. I add them into my numbers, and it now sums to around 20 percent total unemployment.

The popular unemployment number for the Great Depression was 25 percent general unemployment rate. It was 34 percent among non-farm workers. Today, we are mostly a non-farm economy. [[I believe the farm employment share is around 2% today.: normxxx]]

HJR: During the Bush Administration, we heard all the happy talk about how well the economy was doing because of the cuts in tax rates. Is that really just happy talk or was the economy really doing well under Bush?

JW: We actually had a pretty bad recession in the early’90s, longer and deeper than popularly reported. Near the end of H.W.Bush’s first term, at the time of the re-election race, a senior Commerce Department officer talked with a senior executive in the computer industry and asked him to boost the reporting of computer sales to the Bureau of Economic Analysis, which prepares the GDP report. They did, and it boosted the GDP, the broad measure of the economy, and George Bush touted the 'strong' economy. But the average worker just felt he had lost touch with reality.

The average guy has a pretty good sense of reality and knows whether or not economic conditions are good, or if inflation is up or down, which is why people have a difficult time accepting the government’s numbers. They have gotten so far away from common experience that people just don’t find them credible.

In terms of the GDP, clearly retail sales and industrial production were showing us a deepening recession long before the government reported it with the GDP. In fact, you didn’t show a contraction in the GDP until the second quarter of 2008. Officially the recession, according to the National Bureau of Economic Research, started back in December, 2007. If the GDP numbers accurately reflected what was happening, it would have at least shown the contraction two or three quarters before that. Other indications show that the recession really began in late 2006.

HJR: Let me get to a practical issue. What kind of economic activity should we support? For example, the conservatives will say we should cut tax rates to boost the economy. What does your research show?

JW: Cutting taxes is always a good idea. The private sector can do more with the money than the government can. Right now we are in a deep and deepening recession which will probably be called "a depression" before it ends. By depression, I mean a ten-percent contraction in overall economic activity.

When the government is reasonably solid, it can cut taxes. It can even increase spending without disrupting the system. Right now we have a system where the money being poured into the banking system, and the "stimulus" by way of spending and tax cuts, is all on top of record deficits. If you want to look at the real numbers on the deficits, based on numbers published by the federal government, we really should look at it how it used to be.

In the late ‘70s, the ten biggest accounting firms and congress said they could design an accounting system where the government will report its books the same way a company does. They finally got that into effect in 2000. Since then, instead of running deficits in the range of a couple of billion dollars, on a Generally Accepted Accounting Principal (GAAP) basis, the deficit has averaged $4 trillion a year. It was over $5 trillion in 2008 and will top $8 trillion this year.

This is unsustainable! You could not raise taxes enough to bring that into balance. If you wanted to bring it into balance, you’d have to eliminate Social Security and Medicare payments. It can’t be done.

HJR: Right now, Obama is spending money— I won’t say like a drunken sailor, because a drunken sailor spends his own money— but he is throwing trillions of dollars at the economic downturn, assuming it will stimulate us out. My personal opinion is that they are only stimulating government growth, and some day the average person may get a job, but his employer will be Uncle Sam.

What is the end result of creating all this money and throwing it at the problem?


JW: It will not stimulate the economy. The cost of all this is inflation. We will see inflation levels not seen in our lifetime by as early as the end of this year. Eventually we will see liabilities of $65 trillion— more than four times U.S. GDP, more than the global GDP. There will be a hyper inflation where the dollar becomes worthless, where the paper is worth more as wall paper than as currency.

HJR: They couldn’t even use the money as toilet paper because it is a bad absorber of water. So we will have hyper-inflation. How can we protect the value of our assets, assuming that people have some discretionary money? Should they buy growth stocks because they are cheap, assuming "buy low, sell high?" Or are there better alternatives?

JW: We are headed into a hyper-inflationary depression that will become a Great Depression. When hyper inflation hits, it will disrupt the normal flow of commerce and turn it into a Great Depression.

What about paper assets based on the dollar? You want to get into something like gold or silver— physical gold or silver, not paper. Perhaps get some assets outside the dollar. It’s a time to preserve your wealth and assets, not to start speculating on the stock market. There is a lot of volatility ahead. Over the long term, gold and silver are your best hedges.

HJR: That sounds like the familiar tune I’ve been singing for several years. I’ve been publishing for 33 years. About 11 of those years I have been bullish on gold and silver as investments. When I abandoned gold in the early ‘80s, I was excommunicated from the gold-bug church because I was supposed to stay faithful to gold, but then the metals weren’t the right place to put your money.

As a financial adviser, if I don’t have subscribers in the right investments, they will lose money and not renew their subscription to The Ruff Times. So I have a financial interest in being right. Yogi Berra said,
"It’s déjà vu all over again." The same thing is happening that I saw in the ‘70s that drove the prices of gold and silver to unprecedented highs— only more so now.

They are creating more money than they ever thought of creating back then. We are using words like
trillions, which we never used before. I’m not just looking at it as an investment and a place to make money. I am looking at it as a possible way to preserve the real value of your assets so you are not left destitute with a pile of worthless paper.

You showed me a display of Zimbabwe currency, where multi-billion dollar notes started out as
$2-bill notes. We could face the same thing. The world is littered with worthless dead-paper currencies with an average life span of about 75 years. It’s always the same: we make too much of it ever since we created paper currency with the printing press, creating too much of it to buy votes, diminishing its value.

A subscriber who wrote to me recently asked me that if the government and the bankers can manipulate the price of gold and silver, why couldn’t they do that for many years, so that the price of gold and silver would go nowhere? Yet history doesn’t record a single example of when a society inflated the dominant currency even close to the quantities of dollars we are creating now without destroying its value. Gold and silver, not being anyone’s debt or obligation, is where people ought to put their money.

I have been watching your work now for more than two years. I am amazed that you and I have arrived at the same conclusions from different sides of the street. I’ve learned a lot from your view of just the numbers; however, I’m a fundamentalist.

One reason I like you is because you agree with me. We like people who agree with us. Thanks so much for sharing your time and expertise with us.


JW: Thank you very much, Howard. I greatly appreciate the interview. I also appreciate your work. Indeed, we are in very broad and general agreement on where things are headed here. I have followed your work for many years; in fact, your writings back in the 1970s were part of my education as to the nature of the real world. Again, thank you, sir!

Shadow Government Statistics (www.shadowstats.com)

ߧ

Normxxx    
______________

The contents of any third-party letters/reports above do not necessarily reflect the opinions or viewpoint of normxxx. They are provided for informational/educational purposes only.

The content of any message or post by normxxx anywhere on this site is not to be construed as constituting market or investment advice. Such is intended for educational purposes only. Individuals should always consult with their own advisors for specific investment advice.

The Cheapest Real Estate In The World

The Cheapest Real Estate In The World

By Tom Dyson | April 2009

"All of a sudden, it became a monster..."

I was on the phone with my friend Andrew. Andrew is 25 years old. He's been trying to get a business off the ground. Recently, his phones started ringing... and they're still ringing nonstop...

"A guy from Vegas called. He bought 35 houses with cash. Then a guy from Toronto called. He bought eight houses and a 186-unit apartment community. We just had another guy in from Toronto looking to buy 50 rental properties."

Someone else was speaking on a phone a few yards away. More phones rang in the background.

"We're getting calls from all over the world," said Andrew. "Tons of Americans are calling in. It's both. We've launched a website too... and we're already getting a lot of hits. We now have 22 agents working for us, full time."

My friend's city has the cheapest real estate in the world. But in the last six months, prices 'capitulated'. A price capitulation is what happens in the final throes of a bear market. It's the final death spasm that sends prices to ridiculously low levels for a moment before people regain their senses. "They call up and they want to buy houses for $500," Andrew says.

Andrew showed me a house his firm had bought for $750. They bought this house from a bank a couple months ago. It's almost in rental condition. This house sold for $110,000 in 2005.


Then he showed me a house they paid $20,000 for two months ago. It's a four-bedroom, three-bath, 1,900-square-foot house with a full basement. The bank mortgaged this house for $188,000 in 2006. It's in a fantastic neighborhood of well-maintained lawns, where people take pride in where they live.

Andrew is accumulating as much of this property as he can. Apartment buildings in wealthy neighborhoods are his favorite investments. His city is in a depression, and people don't want to own houses. So there's strong demand from people who want to rent. He says he can make returns of 15% to 20% a year in these properties...

Here's the thing: There's always a price that'll "clear" a market. When prices reach a certain level, buyers enter. This is one of the most important fundamental rules of speculation... and it never fails.

Andrew lives in Detroit. For years, there's been no life in Detroit's real estate market. This year, without explanation or fanfare, prices in Detroit property reached its clearance level. Now sentiment has turned around. The phones in Andrew's office have started ringing.

If the market for Detroit housing has found a bottom, maybe the property market in your hometown is close to making a bottom, too...

Good investing,

Tom

.

Look Out Below: Property Still In Sewer
A Look Back At Last Week's Important Events.

[[Actually, the week of the 20th: normxxx]]


By Robin Goldwyn Blumenthal, Ed., Barron's | April 2009

A single word comes to mind to describe global activity in commercial real estate in the first quarter: dreadful.

Worldwide sales volume simply fell off a cliff in the first three months, plunging to one-sixth its level of two years ago— and down 73% from 2008's first quarter— to a paltry $47 billion, according to Real Capital Analytics' quarterly Global Capital Trends report. In the U.S., there was barely $9 billion in commercial-property transactions, a sum that might have represented a single building a few short years ago.

"The commercial-sales market as we once knew it is basically nonexistent," says Dan Fasulo, a managing director at Real Capital and one of the authors of the report. The bid-ask spread is "as wide as it has been since the early '90s," he adds. In the first quarter, new reports of defaulted mortgages and failed commercial-property companies exceeded $55 billion, bringing the total of distressed assets to $153 billion.

The misery was widely distributed: Ireland saw a complete absence of sales, while 17 nations saw sales fall by 80% or more in the quarter versus 2008's first quarter. Price changes, meanwhile, varied from small gains to declines of 40% to 50% below those of a few years ago. Fasulo isn't too sanguine about prospects for improvement in the current quarter, although he notes that "we've seen a trickle of things picking up just over the past few weeks." He points to places like London and Paris, where markets have seen pricing beginning to correct.

To get the market back on track, says Fasulo, the distressed properties need to be cleared out, and the banks, some of which are lending, need to be more generous with their terms.

Now You Tell Us

Bank of America CEO Ken Lewis testified that he was 'pressured' by government officials into completing a deal to buy Merrill Lynch after Merrill's huge losses emerged, and was under the impression that then Treasury Secretary Henry Paulson and Fed Chairman Ben Bernanke 'didn't want him to disclose data about the deal to his investors'. The remarks appeared in a letter to Congress and U.S. securities regulators from New York Attorney General Andrew Cuomo, who is seeking a federal investigation. He said: "I was instructed that 'we do not want a public disclosure.'"

Under Stress

The Fed's methodology for conducting stress tests on the nation's 19 biggest banks is based on a more pessimistic economic forecast. The new criteria assume a 10.3% jobless rate at the end of 2010, a 3.3.% contraction in the U.S. economy in 2009, and just 0.5% growth in 2010. The bank said a need for additional capital wouldn't necessarily indicate a bank's insolvency. The IMF said the U.S. and European banks need $875 billion in equity by next year to recapitalize to pre-crisis levels.

Poor Performance

The Federal Reserve had 'unrealized losses' of $9.6 billion on some $74 billion of subprime mortgages and other toxic securities it took on after Bear Stearns and AIG collapsed. Losses on securities like home loans mean the U.S. taxpayer may have to reimburse the central bank through the TARP program.

The Numbers
The Government National Mortgage Association, known as Ginnie Mae, reported record issuance of mortgage-backed securities in March:
  • $34.5 billion: MBS issued by Ginnie Mae in March

  • $89.7 billion: total first-quarter issuance, versus $38.9 billion in the 2008 first quarter

  • $34.1 billion: total single-family MBS issuance in March

  • $334 million: total multi-family MBS issuance in March


Slight Reversal

The equity markets fell for the first time in seven weeks, though they finished close to their levels of a week ago. The Dow Jones Industrial Average ended at 8076.29 points, and the Standard & Poor's 500 Index closed at 866.23.

Shrinking Output

The global economy is expected to shrink this year for the first time since World War II, the IMF said. It projected a 1.3% drop in output.

Stuck In The Mud

Bank of America shares fell 24% after CEO Ken Lewis said credit "is bad and eventually will get worse before it… improves". The comments came after BofA posted a $4.2 billion profit, half of it due to 'accounting changes', but raised reserves for its other businesses. Morgan Stanley posted a loss, and slashed its dividend 81%.

No Public Placement

New York officials said they would ban lobbyists from soliciting business in public pension funds, amid a widening corruption investigation.

Mixed Bag

Ford posted a loss, but doesn't expect to see U.S. aid. General Motors will sell Pontiac. Chrysler moved closer to bankruptcy.

Odds 'N' Ends

New York Times posted a loss; it has no plans to go private.

Microsoft posted a drop in quarterly revenue, its first in 23 years.

ߧ

Normxxx    
______________

The contents of any third-party letters/reports above do not necessarily reflect the opinions or viewpoint of normxxx. They are provided for informational/educational purposes only.

The content of any message or post by normxxx anywhere on this site is not to be construed as constituting market or investment advice. Such is intended for educational purposes only. Individuals should always consult with their own advisors for specific investment advice.

Sunday, April 26, 2009

Martin Armstrong: Economic Confidence Model Turn Date Is At Hand

Economic Confidence Model Turn Date Is At Hand
Click here for a link to ORIGINAL article:
By Martin Armstrong | 24 April 2009

Martin Armstrong says Major Turn at Hand— Batten Down The Hatches, Or…

A turn date in Martin Armstrong's Economic Confidence Model passed on April 19th or 20th, depending on how many days you use to calculate a year. The graphic shows that the model is predicting a top at this turn date before heading down into a long-term low in June 2011. As Martin explains in the essay below, the model does not necessarily mean that a top in the Dow Industrials is at hand.

For instance, the 1989 turn date forecasted a top in the Japanese Nikkei. The Economic Confidence Model was created with inputs from around the world and therefore is not limited in scope to just pinpointing (U.S.) stock market tops and bottoms. Personally, I am looking at the US Dollar, the Treasury market or the Shanghai market for signs of a top. All these markets have experienced strong rallies off of recent bottoms and might be ready to turn lower.


[ Normxxx Here:  FWIW, Martin Armstrong seems like a certifiable nut case. However, many of his "turn" dates have proved eerily prescient.  ]


Why (Prospective) Models Are Our Only Hope

Should we create a model to manage our social-economy?

In the real world, experience counts as the primary attribute in any field. The question we face in the middle of this economic crisis is simply this: "Is there anyone at the helm who has any (immediately relevant) experience at all?" Can we disregard gathering the experience of those who have gone before us by constantly re-inventing the wheel for every crisis? Wouldn’t it be nice to have gathered a database so that when an economic panic took place, and we tried a particular stimulus, the result was a particular effect? Yet for every economic crisis, we seem to start over at the beginning retaining no knowledge or experience from the past, assuming in our arrogance that "that was then, this is now".

It is time to start taking advantage of the collective progress/knowledge of man that has developed, particularly during the last Century. We have not merely landed on the Moon, we have developed sophisticated computers to get us there. We have even conquered many forms of disease, also through the process of scientific learning and reasoning.

Science has revealed that our greatest form of knowledge comes not from book learning, but from hands-on experience. We have even begun to unravel how the human mind works. Now we understand that the difference between "book smart" and "street smart" is based upon the fact that when we learn only from study, we do not acquire the deeply seeded and critical knowledge base that our mind constructs when using all of the senses we refer to as 'experience'.

When we actually do something, we use all our senses and construct a knowledge base recording all the little nuances that are not always self-evident as being either important or relevant. I could read every book on brain surgery, but would you like to be my first live patient? Just as a medical student might have perfect book scores, they must still then start at a teaching hospital working under the critical guidance of those who have had actual, 'hands-on' experience.

The Importance Of Experience

What has emerged from the study of the human mind is that it takes practical experience in a field to truly comprehend what to do. There are two broad categories of memory as explained by Eric Jensen in his excellent work, "Teaching With The Brain In Mind."(ASCO— Assoc for Supervision and curriculum Development (2005)). The two primary types of memories are: (1) "explicit" (clearly formed or defined) that is constructed either by learning in a semantic manner (words and pictures) or more episodic (autobiographical or personal experience rather than learning about it second or third hand through books); and (2) "implicit" (implied by indirect means) that includes the reflexive memories and procedural physical or motor type routines like riding a bike, burning your hand, love, and other 'real-life' experiences.

Jensen points out that students that are typically taught by merely 'dumping on' facts, rarely retain such knowledge (ibid/pg 132). Jensen pointed out that studies have shown that students who attended class retained only 8% more than those who skipped class. Consequently, this semantic method of knowledge gathering is highly limited.

We need something more to strongly bond critical knowledge within our minds. We need the emotive forces of actual experience, which can be invoked only through the ancient method of hands-on 'apprenticeship'— which involves all the senses. It is now understood that the 'episodic' memory process "has unlimited capacity" (ibid/pg 134). This puts flesh on the words "book smart" and "street smart" illustrating that it is highly dangerous to trust the operation of anything to someone who has no real world experience of it.

Gathering Experience

This is why we need to collect the experiences of mankind and record them to a database that allows human interaction to query "why" events take place and "when" an event should take place, as well as "what" should be the correct response, and "how" should that response be implemented. [[In particular, such an experiential database must allow for learning, so that— as in humans— new knowledge is added onto and does not simply replace old knowledge.: normxxx]] History tends to 'repeat' because as a society we do not learn from past written histories. We lack the capacity to acquire real knowledge— of deep understanding— except through actual experience.

If we are afraid to construct such a model— that incorporates the total global experience of mankind to better manage our society and our economy— then we will be doomed to repeat the mistakes of the past, relying on an imperfect understanding of what the past has to tell us. [[Which, of course, begs the question of whether we have the capacity to construct any such model as yet that would not be very seriously limited. The "economic models" of our leading 'econometricians'— notoriously less reliable than that of meteorologists predicting weather— does not allow for such a sanguine assumption!: normxxx]]

History is no "random walk" through time. Everything is event driven, and history 'repeats' largely due to the fact that given similar events, mankind will react within a set parameter of reactions. [[On the other hand, while many historians try to supply one, history does not come complete with a plot— as witness how the same events are variously interpreted by different historians and at different times. I, myself, have a fixed belief that given a particular period of history to do over again, it would all come out differently!: normxxx]] Stick your finger in the flame of a candle and it matters not what culture you are from or the language you speak. You will still pull your finger out of the flame. [[But social forces are infinitely more complex than such a simple stimulus— as are the reactions of different human cultures, in time or place!: normxxx]]

Understanding There Is A Business Cycle

As I have stated many times, there is always a cycle within everything [[easy to say; quite another matter to prove, as many have tried over the millenia: normxxx]], and that includes the boom and bust swings within our economy that have caused so much political unrest, that it has fueled even the birth of Communism & affected the lives of mankind throughout recorded history. Economic swings have led to wars when a king’s finances were running low, and may have inspired the dreams of a utopia that influenced Karl Marx (1818-1883)— whose ideas have cost the lives of many millions of people.

Cycles may come in different patterns and are at times driven by a convergence of many individual events each functioning separately according to its own cyclical nature. This is simply the very essence of how everything functions throughout life and the entire universe. It is the cyclical nature of life from the beating rhythm of your heart, the cyclical events of the seasons, weather, movement of planets, to even how artificial gravity is created by the cyclical spin[!?!] Even the music we listen to must have a cycle or rhythm. Our 'social interaction' that we call our economy, is no different. [[On the other hand, every attempt to seperate out the 'different cycles' of the Dow Jones average, for example by Fourier analysis, have led analysts to the conclusion that the Dow Jones average is merely 'pseudo' cyclical.: normxxx]]
What Eric Jensen points out is critical to our understanding of our very ability to learn and advance as individuals. This method of acquiring knowledge applies to us as a society. Jensen explains there are differences between how our brain processes "verbal or spatial information." When we process written or verbal words in an 8 hour session there was an 80 minutes cycle for cognitive performance while the spatial task of locating points seems to cycle at 96 minutes, on average, (ibid/pg. 49).

While there is a genetic foundation for being smart, this accounts only for about half of our intelligence. In fact, a part of the brain deals with 'discrepancies' and is automatically activated when the outcome differs from our 'expectations'. This is the anterior cingulate and seems to be hard-wired to enable us to learn— acquire knowledge— through 'trial and error'. Jensen makes it clear that we also learn through 'social interaction'— or lack of thereof. 'Social isolation' is devastating to one's mental and physical health as well, (ibid/pg 95).

Even in prisons or POW camps, solitary confinement absent any social contacts is seen as a devastating punishment that can force its subjects to comply with the demands of the jailer. We are also familiar with the problem of 'infectious' group behaviors that can take the form of 'peer pressure' or imitative behavior among members of spontaneous groups ('mobs') or affiliative groups as demanded by Fascism or Communism— turn in your neighbor (or father or mother or sister or brother) if s/he says anything 'derogatory' of the government. These are forms of mental duress imposed by all forms of governments to varying degrees.

To continue reading this long essay go (HERE). It provides a broad overview of how Martin Armstrong built his model and how one should interpret its signals. He also provides thoughts on how government may use the model to better affect policy. While it doesn't contain any specific predictions, it is a fascinating read. Portions have been edited in order to make his ideas a bit clearer.

You can also access most of Martin Armstrong's recent essays at http://www.scribd.com/ (search on Martin Armstrong).

  M O R E. . .

Normxxx    
______________

The contents of any third-party letters/reports above do not necessarily reflect the opinions or viewpoint of normxxx. They are provided for informational/educational purposes only.

The content of any message or post by normxxx anywhere on this site is not to be construed as constituting market or investment advice. Such is intended for educational purposes only. Individuals should always consult with their own advisors for specific investment advice.

Saturday, April 25, 2009

Trading Volume Separates Bull Markets From Bear Rallies

Trading Volume Separates Bull Markets From Bear Rallies
Click here for a link to ORIGINAL article:

By William Hester, CFA | April 2009

All rights reserved and actively enforced.
Reprint Policy


One of the platitudes most constantly quoted in Wall Street is to the effect that one should never sell a dull market short. That advice is probably right oftener than it is wrong, but it is always wrong in an extended bear swing. In such a swing the tendency is to become dull on rallies and active on declines.
— William Peter Hamilton, The Stock Market Barometer (1909).

Volume tends to expand in the main direction of the trend. In a bull market, advances accompanied by increasing volume or declines on diminishing volume are taken to be bullish. Conversly, in a bear market, declines are accompanied by increasing volume and advances show diminishing volume. Volume should always be studied as a trend (relative to what has preceded).
— Richard Russell, The Dow Theory Today

The bottom is preceded by a period in which the market declines on low volumes and rises on high volumes. The end of a bear market is characterised by a final slump of prices on low trading volumes. Confirmation that the bear trend is over will be rising volumes at the new higher levels after the first rebound in prices.
— Russell Napier, Anatomy of the Bear (his study of the four great stock market bottoms of 1921, 1932, 1949, and 1982).

Whether it was William Peter Hamilton observing the trading activity of the 19th century, or Richard Russell who has studied the market's real-time price and volume action for more than 50 years, or Russell Napier who took the time for an in-depth review of the 4 greatest buying opportunities in the 20th century, each came to a similar conclusion: to confirm a change in market conditons, watch trading volume closely. By this measure, the market's recent rally still has much to prove.

The graphs below attempt to provide visual support to the idea that volume matters as a characteristic of a rally— especially one that is so widely annointed as the beginning of a new bull market. The graphs will hopefully also add to the comments John Hussman has made— including those in last week's Green Shoots over Thin Ice and December's Recognition, Fear and Revulsion. Specifically, bear markets don't typically end in a crescendo of fear and panic, but more often on a feeling of "despair and disillusionment," while strong bull markets tend to feature heavy trading volume.

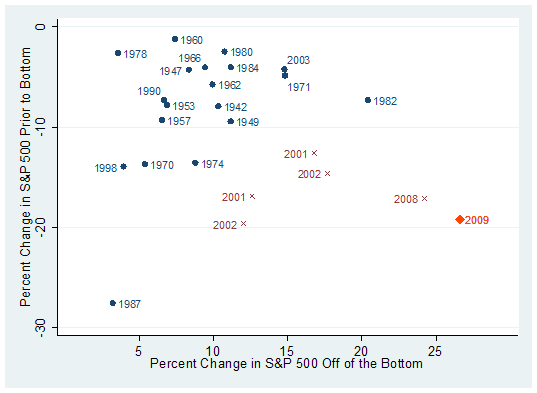
In each of the charts below the blue dates represent the beginning of each bull market since 1940. The red dates represent this decade's bear-market rallies, including 4 during the 2000-2003 bear market and the rally that lasted from November of last year through January.

In the first graph below, the vertical axis shows the 4-week percent change in the S&P 500 beginning a month prior to each trough in the market. It attempts to capture how sharp the final move was to the low. The horizontal axis shows the 5-week change in the S&P 500 off of the bottom. It attempts to measure the intensity of the rally that followed.

Data that fall in the upper left portion of the graph represent periods where the market bottomed with little fanfare, and the rally that followed was similiarly uninspiring. Data that fall to the bottom right represent periods where a sharp rally off of the bottom approximated the severity of the preceding decline.


Click Here, or on the image, to see a larger, undistorted image.


To some extent, all stock market bottoms carve out a ‘V' bottom. Prices move lower, and then change direction. But look at the clump of blue data points in the upper left portion of the graph. These aren't the capitulations that most investors have in their minds when they think of a classic bear-market V-bottom. The bulk of bear markets have ended by falling less than 10 percent in the final month— and were followed by similiarly modest moves off of the bottom.

There are exceptions which include 1987 and 1998. But those corrections were sharp and condensed. Even so, they were both followed by tepid rebounds in the initial upswing.

Look at the bear-market rallies in red. The characteristic that these periods share is that they frequently carve out an acute bottom— a capital ‘V' to the typical bear-market bottom's lowercase ‘v'. In each of the 5 cases, a sharp condensed decline created an oversold condition, which was then followed by a similarly powerful rally.

Since it's unknown whether the recent advance is a rally within a bear market or the beginning of a new bull market, the market's performance in 2009 is denoted in orange. It sits far away from the blue data points, and shares its space with the 5 previous bear-market rallies. And while much has been said about the strength of the rally this year, the graph shows that it's consistent with the severity of the decline that preceeded it. The S&P 500 fell 26 percent from it's peak in January to the March low. It's rallied since March by roughly the same amount.

This is not to say that the market never rallies strongly at the beginning of a bull market. During the first weeks of the bull markets beginning in 1971, 1982, and 2003 the market rallied impressively in a short period of time. But an important distinction is that the approach to their final lows was distinguished by a more moderate decline when compared with each bear market rally.

Missing Volume

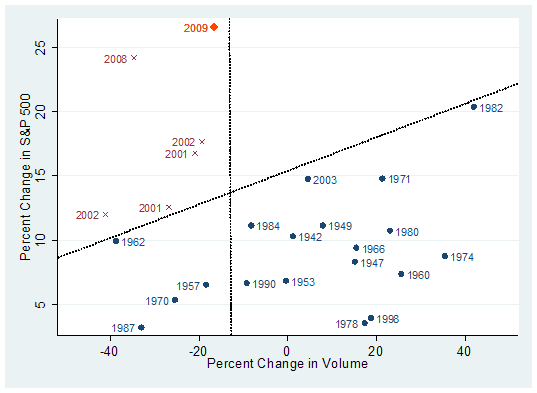
The second characteristic of a trustworthy bear-market bottom is that the rally that follows tends to coincide with a healthy increase in volume. The chart below again shows all of the bear-market bottoms since 1940 in blue and the 5 most recent bear-market rallies in red, along with this year's advance. This time the vertical axis measures the 5-week percent change in the S&P 500 from each bottom. The horizontal axis measures the 5-week percent change in NYSE volume (smoothed). The two dotted lines group the data into three separate areas.

Data points that fall in the upper left portion of the graph represent powerful rallies on contracting volume. Data points that fall in the lower right portion of the graph represent steadier advances with increasing volume or slightly contracting volume. The lower left portion represents bull-market bottoms that began with contracting volume.


Click Here, or on the image, to see a larger, undistorted image.


It appears that bear-market rallies like to stick together. Here you can see the characteristics these rallies share include strong (even if temporary) returns with contracting volume. Each had strong returns within the first 5 weeks of the rally— and most went on to gain more than 20 percent before rolling over. But it's important to note that volume waned during each of these rallies. And for the most part, the larger the contraction in volume, the more quickly the rally tended to lose steam.

The characteristics of this year's rally are interesting. It's the strongest 5-week rally over the entire data set— even with contracting volume. One positive we can note is that the volume is contracting on this rally less than it contracted in last year's bear-market advance. But the market has also run up strongly on volume that would be unusually weak for a bull market advance of this size.

You can see what most initial bull advances look like in the lower right part of the graph. Except for 1982 and to a lesser extent 1971 and 2003, bull markets tend not to be explosive in their first couple of weeks. And when they are, the moves tend to coincide with a similarly explosive increase in volume. NYSE volume grew by 40 percent in the first 5 weeks or so off of the 1982 bull market. At an S&P 500 dividend yield of nearly 7%, stocks were cheap and investors showed their conviction.

This is not to say that bear-market bottoms can't occur on low or contracting volume. They can, as is shown in the lower left portion of the graph. The bear-market bottoms of 1957, 1962, 1970, and 1987 all began with unimpressive amounts of volume. But they also share another characteristic— early returns were muted. The bull markets that did begin on low volumes didn't have explosive beginnings.

Recruiting Volume

If March 6th proves to be the bottom of the market, Anatomy of the Bear author Russell Napier can put off his next edition for awhile because the most recent bear market won't qualify as a great bottom. That's because even though the market's decline since 2007 has been one of the largest on record, it didn't bring the market to truly great values. In his analysis of the stock market bottoms of 1921, 1932, 1949, and 1982 Mr. Napier chose to use two measures to gauge the valuation of the market.

One was Robert Shiller's PE ratio based on trailing earnings. As I noted in Market Valuations During U.S. Recessions, this ratio has fallen to the mid-single digits during periods of extreme undervaluation. It's currently 15. The second valuation tool Mr. Napier used was the q-ratio, a measure of market valuation relative to the replacement cost of assets. Deep undervaluation for this measure tends to be when market prices are roughly 35 percent of replacement costs. According to the most recent data the q ratio is about twice that.

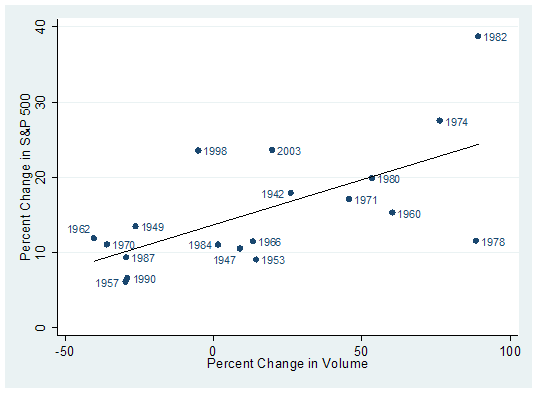
An important observation that Mr. Napier makes in his studies of the most damaging bear markets is that even if the initial move off of the bottom is lacking volume, once a new higher level is reached, the market should begin to attract buying interest. In each of the bottoms he studied, volume expanded noticeably after the initial rally. This idea also holds up for the majority of bear-market bottoms. In the graph below the axes are the same as the graph immediately above. The vertical axis shows the percent change in the S&P 500 while the horizontal axis shows the percent change in volume. But this time the period is 6 months from each bear-market bottom.


Click Here, or on the image, to see a larger, undistorted image.


The line that fits the data slopes upward, implying that the more robust a rally is during the first six months, the better the improvement in volume. Here the bear-market bottoms of 1982 and 1974 stand out. Both provided strong returns that coincided with equally impressive improvements in volume. The periods of 1974 and 1982 are examples where ‘revulsion' and deep undervaluation can combine to create a powerful base from which bull markets launch.

Contracting volume is not enough evidence to qualify that this is a bear-market rally with certainty. There are other measures that are showing more strength— such as various indicators of market breadth. [[But, on the other hand, this market has been marked by unusual wide (negative) market breadth on the way down.: normxxx]] But new bull markets, whether at their inception or soon after, have a history of recruiting noticeable improvements in volume. So far this rally lacks that important quality. Over the next few weeks stock market volume will be a metric to watch closely.

The Predictions Of A Hedge Fund Manager

The Predictions Of A Hedge Fund Manager: Yet Another Cassandra
Click here for a link to ORIGINAL article:

By Nicholas A. Vardy, Global Dividend Opportunities | 25 April 2009

With global stock markets rallying sharply since early March, the mood on Wall Street has shifted remarkably quickly. Recognizing the importance of "Animal Spirits" to the global economy, the U.S. government seems now engaged in a full court press to increase confidence in the financial markets. Investors who bought Citigroup (NYSE: C) and Bank of America (NYSE: BAC) a couple of weeks ago have seen the price of their investments double. Greed has overtaken fear in the markets virtually overnight. The question on everyone's lips is: "Can it last?"

This past weekend, I had the opportunity to spend some time with a few of the biggest names in the hedge fund world. One made more money in 2005 than many small investment management companies have under management. Equally importantly, at one point in his career, he had almost lost it all. So he has the invaluable perspective of someone who has both won and lost big— and of someone who had invested in countries where he learned how governments and individuals behaved in times of crisis.

He made a handful of predictions, most of which put him squarely in the Cassandra camp.

1. All large European banks will go bankrupt. Their "Tier 1" capital levels simply aren't high enough to absorb all of the bad loans they had made to overheated European economies like the "PIGS" (Portugal, Ireland, Greece and Spain) and profligate new EU members like Hungary and Latvia. The price at which the debt of these banks is trading already confirms that their equity capital is wiped out. As a result, European banks will "gate" their deposits by limiting depositors from withdrawing their money from banks to say, 1,000 euros a week.

2. At least one European country will go bankrupt over the next 12 months. Individual countries simply do not have the reserves to deal with a run on the banks. And unlike the United States or the United Kingdom, eurozone countries can't print money at will. If the French wake up one Monday morning and see that the Irish are unable to withdraw their money from their banks, it won't be long before the French are queuing up for their money. The panic will spread like wildfire.

3. The enormous borrowing required to finance the Obama administration's deficit means that interest rates on U.S. Treasuries are set to soar [[but not necessarily anytime soon: normxxx]]. All the government efforts are in vain anyway. And anyone who is in political office now will be out soon— whether by coup in the third world or by elections in the developed world.

4. The Chinese economy is toast. With 45% of its economy relying on exports, China has never been much more than a workshop for Wal-Mart. With U.S. consumers re-trenching— traffic to ports in Southern California is down 35%— the Chinese have little to offer to the world. Even Russia is better off. At least it has natural resources— money it can suck out of the ground.

5. The recent market action is a sucker's rally. Gold is the only safe haven. The price of gold is set to soar. [[Gold can always be confiscated, one way or another. A safer bet may be to invest in non-PM (base) metals such as copper (which is probably way too high at present, if these warnings come to pass) and oil (which could go down to $35 bbl or even less).: normxxx]] Call the Union Bank of Switzerland (UBS), buy physical gold and store it in a safe. (One caveat: UBS is one of the European banks that is expected to go bust.)

The Predictions Of A Hedge Fund Manager: Do As I Do, Not As I Say

Yogi Berra famously opined that "predictions are hard, especially about the future". But Berra was wrong. Making predictions is easy. It's making money from those predictions that is hard.

Consider the case of our hedge fund manager. You'd think that if he were so convinced of his opinions, he'd put his money where his mouth is. He would short European banks, short the euro, short U.S. Treasuries, short China and be long on gold. Perhaps he has done all those things. But he is also 90% in cash.

But don't hold it against him. Unlike most people who make predictions for a living, he has been through the experience of losing 98% of his money. When he is offering his opinions, he knows that he is playing a different game. He knows that his punchy views will get him attention. But when it comes to managing $4 billion of other people's money in highly uncertain times, he knows when it's best to just sit on the sidelines [[especially when one must factor in the always tricky actions of politicians acting in panic: normxxx]].

The Predictions Of A Hedge Fund Manager: Do As I Say, Not As I Do

Pundits with strong opinions attract attention. After all, when a boring corporate type speaks, most people can barely stay awake. And as any on-air financial commentator will tell you, the biggest sin isn't to draw the ire of critics. The biggest sin is to be ignored.

Contrast our hedge fund manager's investment strategy with that of New York University's Nouriel Roubini, aka "Dr. Doom". Roubini agrees that the recent rally is a "dead cat bounce or bear market sucker's rally." Yet, as reported in the Financial Times, Roubini's own investment strategy has been to be 100% long, invested in index funds. But you have to wonder why.

If Roubini saw the global financial system as the Titanic hitting the iceberg, why did he sit back and watch his 100% long portfolio get cut in two? The disconnect is almost bizarre. But it illustrates the difference between offering predictions— and making money. Strong opinions are terrific. But making money is even better.

When someone whose opinion you agree with has lost 80% of your money, it can wear thin when he still insists, "I wasn't wrong. I was early". That's why predictions are worth taking with a grain of salt. Eighteen months ago, the U.S. dollar, the Iranian president declared, was a "worthless piece of paper." A year ago, Goldman Sachs' chief economist predicted that thanks to "decoupling," China would bail out the world economy. Nine months ago, Russian oligarchs were predicting $250 dollar a barrel oil as they were lighting their cigars with 500 euro notes.

All of those predictions turned out to be spectacularly wrong. The greatest speculator in the world, George Soros, has literally written entire books that were chock full of predictions gone awry. In fact, almost every one of his predictions for 2008 was wrong (see my analysis on video here). Yet Soros managed to eke out a 10% gain, while other big name hedge funds struggled like never before. That's the difference between managing money— and just talking about it.

  M O R E. . .

Normxxx    
______________

The contents of any third-party letters/reports above do not necessarily reflect the opinions or viewpoint of normxxx. They are provided for informational/educational purposes only.

The content of any message or post by normxxx anywhere on this site is not to be construed as constituting market or investment advice. Such is intended for educational purposes only. Individuals should always consult with their own advisors for specific investment advice.