By Dr Housing Bubble | 5 September 2010
California now enters September with no budget in place and a $19 billion budget deficit. As we edge closer to issuing coveted IOUs, the spin cycle is out in full force. A report was issued showing that CEOs at the 50 firms that laid off the most workers since the recession started earned an average of $12 million. I guess the recovery will depend on who you are asking.
Here in California, looking at income data is a good indicator on how the "rest of us" are doing. The state of California depends heavily on personal income taxes. Nearly half the state budget revenue comes from this one source alone. Common sense would tell you that if more people were working, personal income tax collections would be up.
That is not the case. You would also expect hiring to pick up and this is something California is not seeing either (with a 23 percent underemployment rate). The definition of recovery has gotten muddled in this deep recession, the deepest since the Great Depression. Let us look at 10 charts and try to examine what they mean for the future of California.
Chart 1— Unemployment Insurance
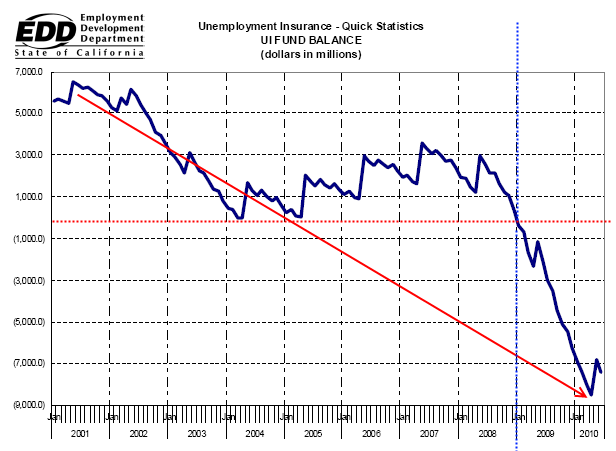
The California Unemployment Insurance (UI) Fund has been on the decline since the early 2000s. Yet we didn't tip over into the red until early 2009. Now, the state owes the Federal government a stunning $12 billion with interest. This is expected to top out at $15 billion by the end of the year.
This money cannot be repaid from UI funds so it'll be interesting to see how we pay this off. Maybe we can strategically default on this loan? One thing is certain here, many people are collecting and are unable to find jobs. These people are looking for work and are definitely not in the market to buy a home or a car.
Chart 2— Initial Claims Filed
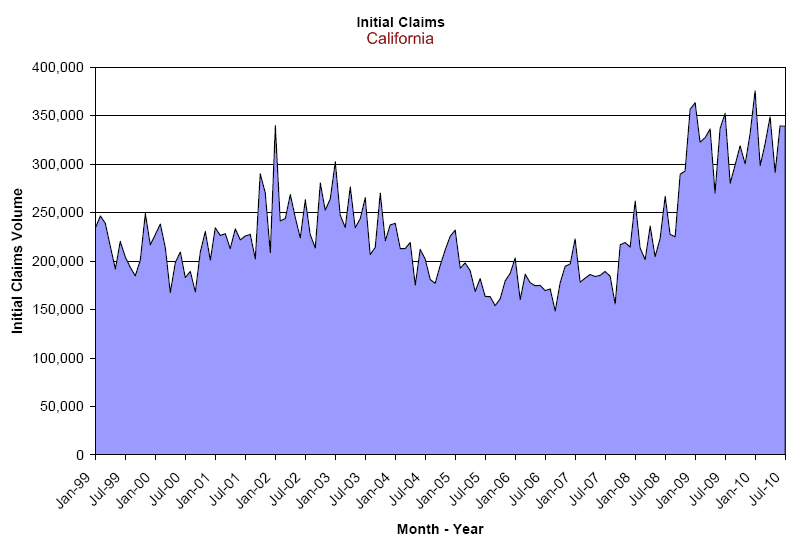
Source: EDD.
For all the talk of a recovery, initial unemployment claims remain elevated. In other words the economy is still doing very poorly when it comes to hiring people for actual work. This number needs to get under 225,000 to even resemble any sort of real recovery. We are far from that as you can see from the chart above.
Chart 3— Monthly Tax Collection
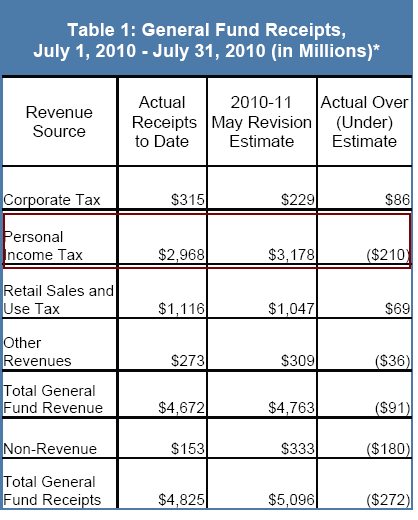
Source: State Controller's Office.
The State Controller's Office issues a monthly report showing tax collections for the state. The latest release shows another drop in personal income collections. Even with the recent May budget revision, we are now coming in $210 million under expectations for the month. The fact that retail sales taxes are up should be no surprise because we actually hiked taxes recently.
The state budget in California is looking more and more unsustainable. On Tuesday, Democrats wanted to raise fees and shift around funds while Republicans want to cut. Both parties put their collective spin on this but— bottom line— is we need to increase taxes or cut spending.
Both parties are part of the big plutocracy so they'd rather put on a bread and circus show and go on the road to raise more money for their November election campaigns. All this is happening while the state flutters around. They had no problem passing a state home buyer tax credit on short notice— but this is because big lobbying dollars from the finance, banking, and real estate (FIRE) industry bankroll many of these politicians.
Chart 4— Homeownership Rate
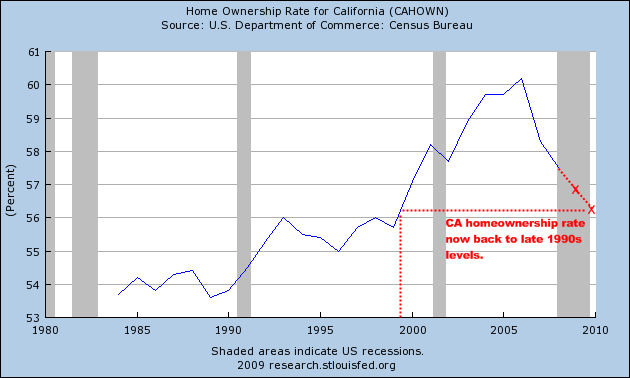
Don't look now but we've now erased over a decade of homeownership gains in the state. Given the large amount of toxic waste mortgages, I wouldn't be surprised if we have a few more quarters of this rate going down. If things were really doing well, don't you think this rate would be going up because people would be buying homes? Or at the very least, people would be paying their mortgage and keeping the rate steady.
That is clearly not the case.
Chart 5— Rental Vacancy Rate
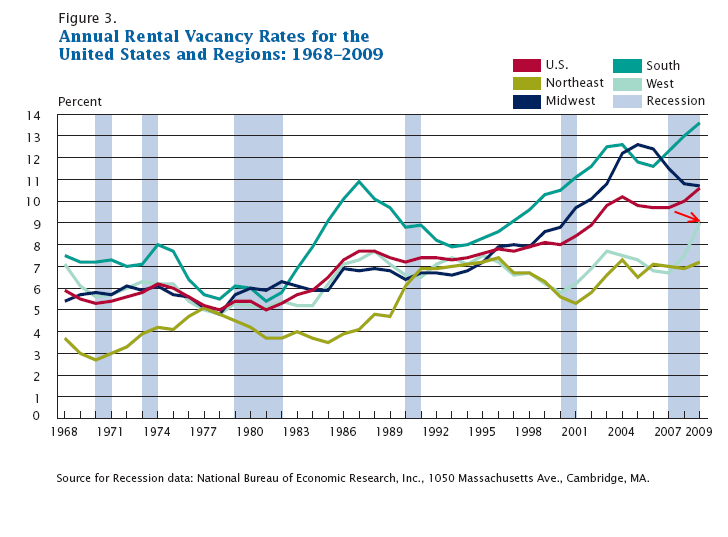
Another reason why we will only muddle through is because short-term policies on pumping the home buying spree have caused a glut in rental real estate. Rental prices have fallen in California for over a year now. There are some very good deals to be had. So now, all those vacant homes and people trying to sell homes will contend with those outstanding rental deals as a further depressant for sales.
Look at the above trend for the west. The rental vacancy rate is at an all-time high which means lower prices and yet more supply on the market. Of course, policy makers were only concerned with short-term gains. Short-term gains are actually what fueled the toxic mortgage craze of the last decade in the state.
Very few people bought with the idea of staying in their community for more than 5 years. It was all about buying and "moving up" the property ladder until you owned the biggest McMansion on Stanford, Harvard, or whatever university name avenue. Now that we are running on fumes, the idea of the "American Dream" has shifted once again.
Chart 6— Construction Spending
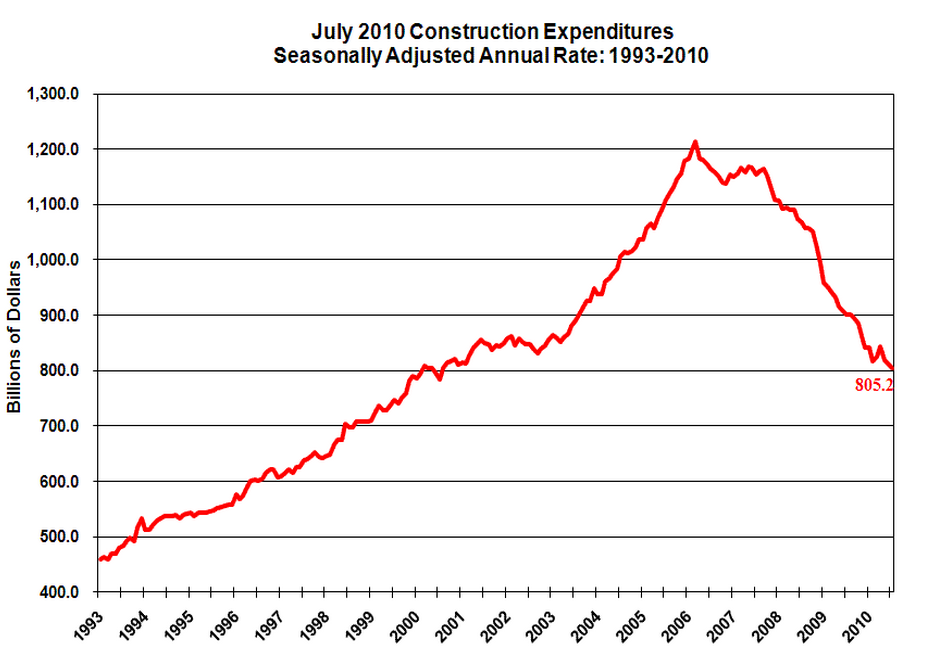
I've seen the argument made that people should buy in high priced areas because "you know construction prices" won't be coming down anytime soon. Really? Look at the above chart. Construction spending has collapsed and with it, the cost of building.
Right now, there is such a glut of houses, condos, and commercial real estate that there is little reason to build. Yet those in higher priced areas continue to live in their bubble. The correction is already there and will accelerate over the next year.
Just look at construction employment for California:
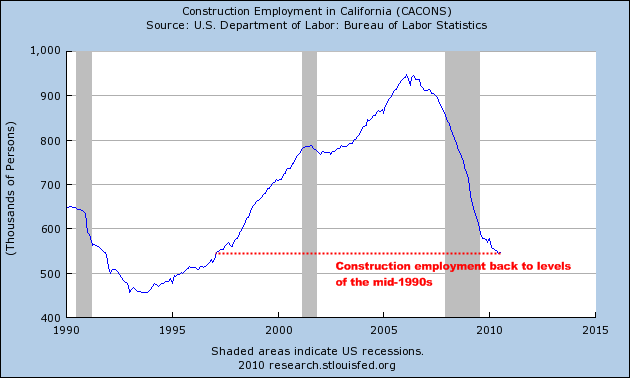
I'm sure you have many contractors who would do the job for 10, 20, 30, or even 40 percent off their peak level prices rather than being out of work.
Chart 7— Personal Income Tax Trend
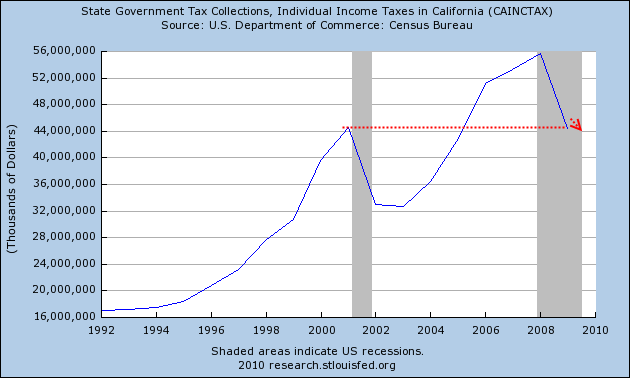
This chart should be called a story of two bubbles. We are now back to state income tax revenues from the previous peak with the tech bubble. Unless we can find another bubble, the state will now need to adjust. As we have said, this can only be achieved through two methods— tax hikes or spending cuts.
It certainly isn't coming from a better real economy at the moment. So the options are limited. Either available option, however, is bad for the state economy and housing. You know those sacred property taxes in California? Local counties not being reimbursed by the state are finding out the new ways to get around this:
|
In Bell, with their fun loving politicians, the state controller blocked an 'illegal' property tax hike:
|
As I said years ago, don't think that property taxes are some kind of third rail of politics. Right now California politicians have a popularity rating in the single digits. What do they have to lose?
Chart 8— New Home Sales
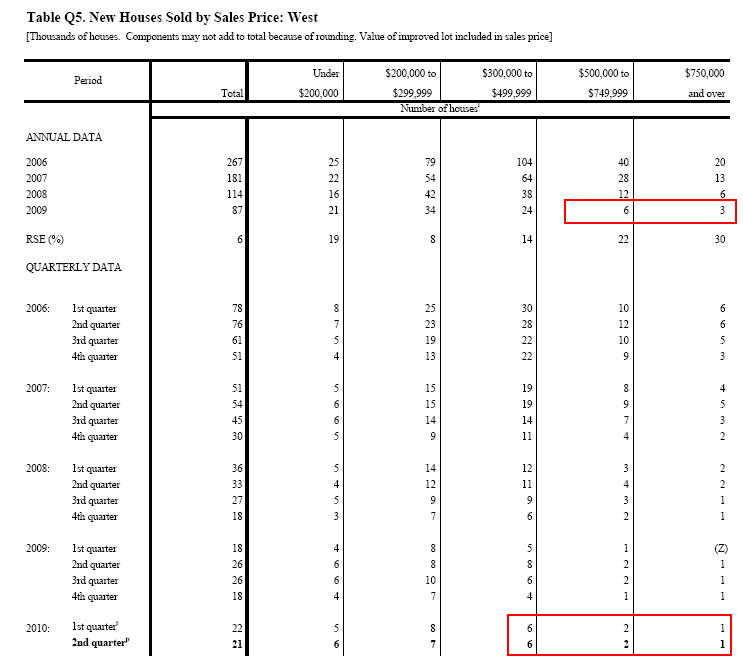
Click Here, or on the image, to see a larger, undistorted image.
The amount of high priced sales has collapsed with the housing bubble. California is dominated by expensive homes in many 'niche' markets. The amount of sales has come to a screeching halt for many areas in this segment. Some areas will always have strong buyers, but it isn't likely to be where 99 percent of the public currently lives.
The above chart reflects this change in home sale dynamics. Why should this trend reverse? Unless incomes can suddenly pickup with employment gains, then an argument can be made in favor of this. Do the above charts show this trend emerging?
Chart 9— Fire Economy
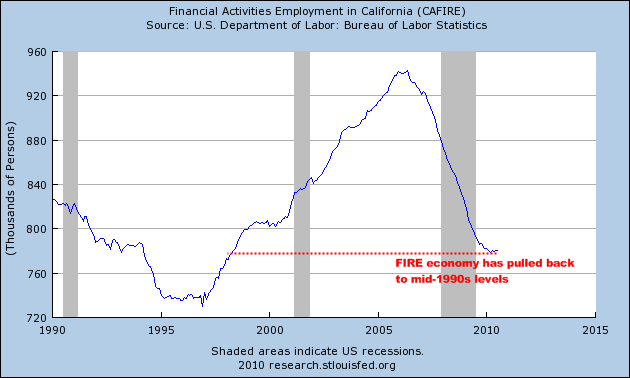
Just as the tech bubble of the 1990s, the real estate bubble of the 2000s fueled the state with tons of bubble wealth. These were high paying jobs with tons of taxes being collected not only from the personal income tax side, but also on the conspicuous consumption side. So the state loved this bubble in a multitude of ways:
• Higher property taxes due to inflated assessments
• Big personal income tax payments from brokers, bankers, agents, etc.
• Massive boost in sales tax income from big ticket items
It was a win-win— at least for those in this industry and the state and local government hierarchy. But look at the above chart. Employment in the FIRE economy is back to levels of the late 1990s. Unless a new housing bubble emerges, there is little reason to believe this industry is coming back to anything like the old bubble days.
Chart 10— Leisure And Hospitality
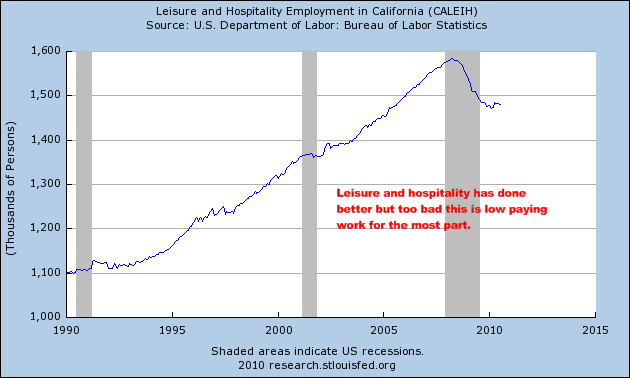
One of the brighter notes is that leisure and hospitality employment didn't decline as badly as other sectors during this recession. On the flip side of this coin, this industry typically doesn't pay great or reliable wages/benefits. We already have 4 out of 10 Americans working in low paying service sector jobs, so maybe this is part of a bigger trend. After all, those blue collar manufacturing jobs are now long gone:
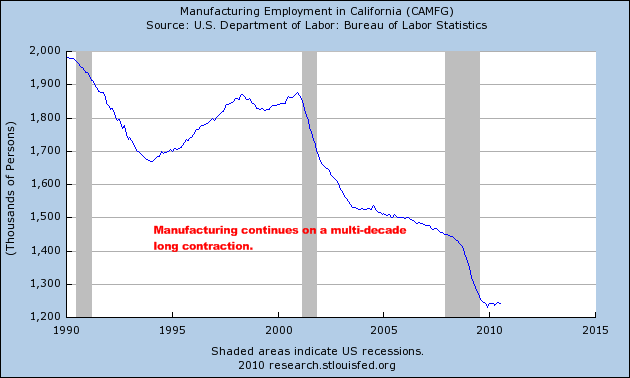
California also has a large aerospace engineering sector and companies that cater to military spending. Official combat operations are now over for Iraq. Do you think that the demand for billion dollar military equipment is going to remain high? This isn't exactly a sector where you can export the 'surplus' to other nations, since the public might have a tiny problem with that.
Either way, it seems pretty clear when looking at this data that we are in for a long correction. Housing certainly doesn't seem to have any support for higher prices. On the contrary, it would seem that the momentum now is toward still lower prices. I made a prediction awhile back about 2011 being the bottom for California. [[It now looks more like it will be 2012 before the bottom occurs, for California and the nation.: normxxx]]
At the time, we were bailing out the big GSEs and trying to gather ourselves. Home prices for California have fallen since that time and there were many rumblings back then that it was a bottom. Much has changed since then.
And since that time two years ago Fannie Mae and Freddie Mac continue to be giant trash bins of taxpayer money. Banks keep their mouth closed on this issue because 95 percent of their loan volume is government backed. Either way, the median price for a California home is likely to go lower.
The state government is one giant mess and has only managed to stay just functional for the past two decades because of giant bubbles that masked their inability to govern. But now, the rubber is hitting the road and increased taxes and cuts seem to be the only solution. Don't expect any action until November, however, as we muddle into this election season.
ߧ
Normxxx
______________
The contents of any third-party letters/reports above do not necessarily reflect the opinions or viewpoint of normxxx. They are provided for informational/educational purposes only.
The content of any message or post by normxxx anywhere on this site is not to be construed as constituting market or investment advice. Such is intended for educational purposes only. Individuals should always consult with their own advisors for specific investment advice.
No comments:
Post a Comment