By The Consumer Metrics Institute | 21 September 2010
|
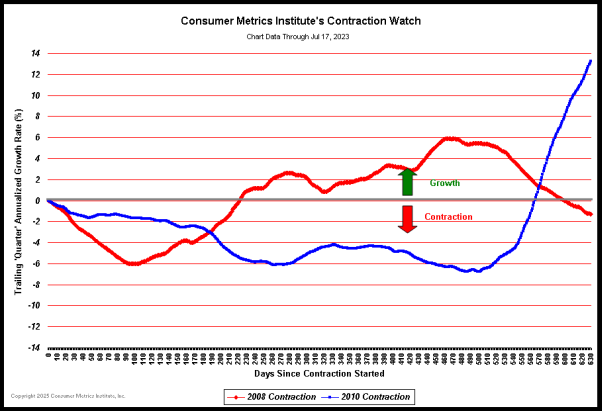
Consumer Metrics Institute's Contraction Watch
Notes:
The comparison of the 91-Day Growth Indexes during the 'quarter' immediately following the commencement of a contraction. The contraction events of 2008 and 2010 are shown against the same scale of annualized contraction.
September 18, 2010— Has the Bottom Been Reached?
During the month and a half from August 1 to September 15, our Weighted Composite Index has improved substantially, rising from recording a year-over-year contraction rate in excess of 9% to recently registering a contraction rate near 3%. This is the largest positive movement that we have seen over half of a quarter since late 2009. The improvement has stopped (at least temporarily) the decline of our 91-day trailing quarter average (our Daily Growth Index).
We have previously pointed out that the true severity of any contraction event is the area between the "zero" axis in the above chart and the line being traced out by the daily contraction values. By that measure the "Great Recession of 2008" had a total of 793 percentage-days of contraction, and its severity can be visualized as the amount of area covered by the red stripes in the chart below:

Similarly, the current 2010 contraction has just reached 592 percentage-days, and its severity can be visualized as the amount of area covered by the blue stripes in this chart:

The blue stripes above already cover about 75% of the area covered by the 2008 "Great Recession", and the curve has only just begun to start back up. Looking ahead, should the 2010 event recover from its bottom exactly as the 2008 event did, it would still experience another 466 percentage-days of contraction before ending— resulting in a grand total of 1058 percentage-days of contraction for the 2010 event, fully 33% more severe than the "Great Recession of 2008." This, of course, assumes that stimuli comparable to those seen in 2008-2009 will be available to cause such a recovery during 2010-2011— and that unemployment quickly returns to the levels that helped consumer demand start to rebound in late August of 2008: about 6.1%. Absent fresh consumer stimuli and dropping unemployment rates, the consumer demand contraction we are witnessing could very well linger.
Over the past month and a half we have seen a substantial reduction in the year-over-year contraction of consumer demand. That said, it is important to remember that consumer demand is still contracting, albeit at a slower rate. We have previously used the analogy that our data is far "upstream" in the economy. We are sampling the behavior of internet shopping consumers on a daily basis. Those consumer activities flow "downstream" to factories over the course of weeks or quarters. It's not unlike being upstream on a great river and watching a water-level gauge predict that downstream communities will be flooding catastrophically in a few days or weeks. Although our flood-gage may have just peaked, the downstream damage remains inevitable— it simply hasn't arrived yet.
ߧ
Normxxx
______________
The contents of any third-party letters/reports above do not necessarily reflect the opinions or viewpoint of normxxx. They are provided for informational/educational purposes only.
The content of any message or post by normxxx anywhere on this site is not to be construed as constituting market or investment advice. Such is intended for educational purposes only. Individuals should always consult with their own advisors for specific investment advice.
No comments:
Post a Comment